Winnipeg (CNS Canada) – The ICE Futures Canada canola complex finished higher on Thursday, pushed up by a USDA report that surprisingly lowered the amount of soybeans that are expected to be planted in the United States.
The market was also chopping around a bit as traders looked for safe positions to park their money in.
Road restrictions are coming into effect across Western Canada, which is expected to limit farmer sales going forward.
A recent rise in canola exports underpinned values.
However, the Canadian dollar was slightly stronger, relative to its U.S. counterpart, which made canola less attractive to international buyers.
Read Also
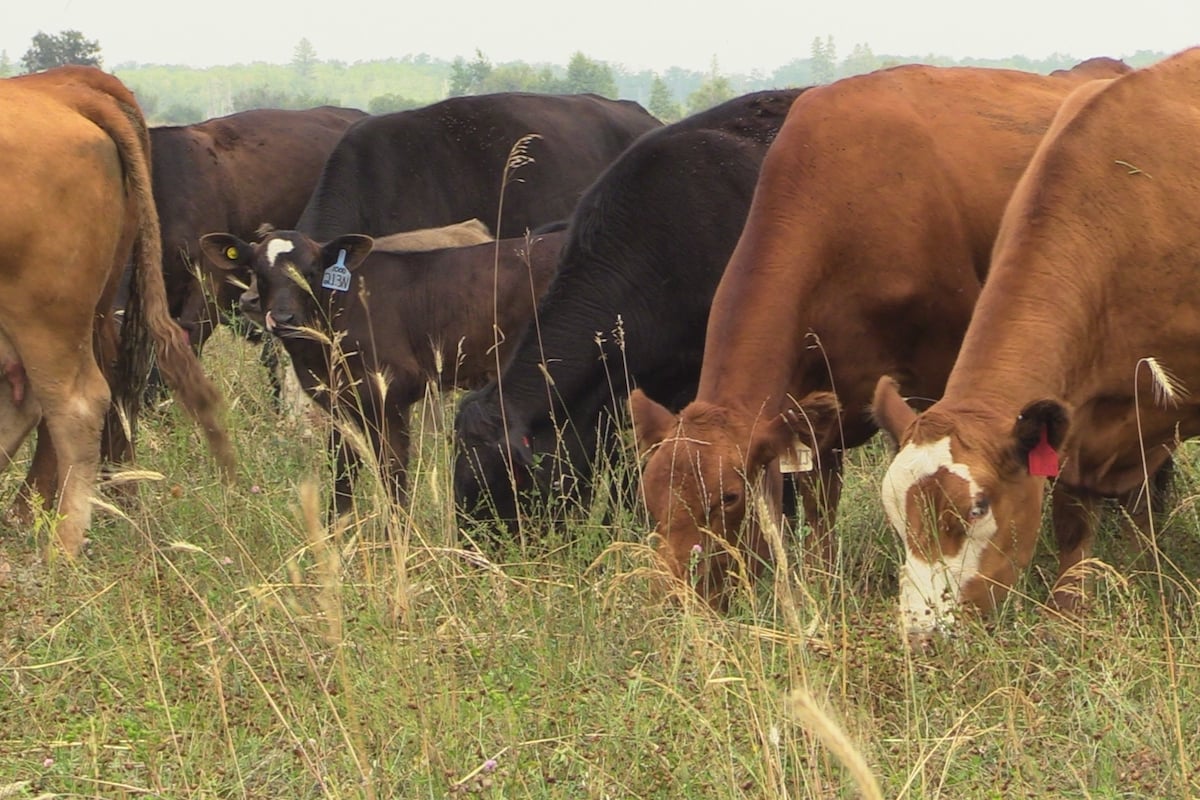
Klassen: Feeder market softens on weaker demand
For the week ending October 25, Western Canadian yearling markets traded steady to $10/cwt below prices from the previous week….
Around 34,884 canola contracts were traded on Thursday, which compares with Wednesday when around 14,011 contracts changed hands. Spreading accounted for 6,422 of the contracts traded.
Settlement prices are in Canadian dollars per metric tonne.
The soybean market posted sharp gains on Thursday with the release of the USDA’s planting intentions and grain stocks reports.
The USDA pegged soybean acreage at 88.9 million acres, which was well below traders’ guesses of 90 to 91 million. The estimate sent prices higher and also put soybeans in a position to rise further if the weather turns sour.
Soybean stocks in the United States are expected to rise to 2.1 billion bushels, which was higher than expected.
There is suspicion that some of the lower acreage could be due to financial pressure on farmers in the U.S., which means some fields could be left to fallow.
Corn futures jumped on Thursday as the USDA’s projection for corn acreage prompted a flurry of buying.
The USDA pegged corn acreage at 88 million acres, which was lower than last year’s total of 90.2 million acres.
Corn stocks were estimated to be a whopping 8.9 billion bushels, which was higher than most traders’ estimates.
Chicago wheat futures recorded solid gains, taking strength from the corn and soybean markets.
The agency said it believed farmers in the U.S. would plant 47.3 million acres of wheat, which was lower than what some investors were expecting to see.
In the Midwest, some rain was reported in Kansas this morning, which should help alleviate some of the excess dryness.
OUTSIDE MARKETS
Light crude oil nearby futures in New York were up 56 cents at US$64.94 per barrel.
In the afternoon, the Canadian dollar was trading around US77.60 cents, down from 77.37 cents the previous trading day. The U.S. dollar was C$1.2887.
Winnipeg ICE Futures Canada dollars per tonne.
Canola May 18 522.70s +0.90 +0.17%
Canola Jul 18 528.40s +1.60 +0.30%
Canola Nov 18 516.60s +0.60 +0.12%
Canola Jan 19 520.10s +0.20 +0.04%
Canola Mar 19 521.30s -0.40 -0.08%
American crop prices in cents US/bushel, soybean meal in $US/short ton, soy oil in cents US/pound. Prices are displayed with fractions (2/8, 4/8, and 6/8) instead of decimals. -2 equals .25, -4 equals .50, -6 equals .75. The “s” means it is the settlement.
Chicago
Soybeans May 18 1044-6s +26-6 +2.63%
Soybeans Jul 18 1055-4s +26-6 +2.60%
Soybeans Aug 18 1058-0s +27-4 +2.67%
Soybeans Sep 18 1051-2s +30-0 +2.94%
Soybeans Nov 18 1047-6s +31-2 +3.07%
Soybean Meal May 18 384.0s +12.7 +3.42%
Soybean Meal Jul 18 386.3s +12.6 +3.37%
Soybean Meal Aug 18 383.2s +12.7 +3.43%
Soybean Oil May 18 31.87s +0.25 +0.79%
Soybean Oil Jul 18 32.13s +0.25 +0.78%
Soybean Oil Aug 18 32.26s +0.26 +0.81%
Corn May 18 387-6s +14-2 +3.82%
Corn Jul 18 396-2s +14-0 +3.66%
Corn Sep 18 403-2s +14-2 +3.66%
Corn Dec 18 411-4s +14-4 +3.65%
Corn Mar 19 418-2s +13-6 +3.40%
Oats May 18 225-0s +3-2 +1.47%
Oats Jul 18 233-6s +3-2 +1.41%
Oats Sep 18 239-4s +1-0 +0.42%
Oats Dec 18 250-6s +1-4 +0.60%
Oats Mar 19 256-6s +0-6 +0.29%
Wheat May 18 451-0s +5-4 +1.23%
Wheat Jul 18 468-4s +5-6 +1.24%
Wheat Sep 18 485-2s +5-6 +1.20%
Wheat Dec 18 506-4s +5-4 +1.10%
Wheat Mar 19 522-2s +5-2 +1.02%
Minneapolis
Spring Wheat May 18 578-4s -11-0 -1.87%
Spring Wheat Jul 18 586-4s -11-4 -1.92%
Spring Wheat Sep 18 594-0s -11-4 -1.90%
Spring Wheat Dec 18 607-0s -11-2 -1.82%
Spring Wheat Mar 19 618-4s -9-4 -1.51%
Kansas City
Hard Red Wheat May 18 467-2s +6-2 +1.36%
Hard Red Wheat Jul 18 486-2s +6-2 +1.30%
Hard Red Wheat Sep 18 505-2s +6-4 +1.30%
Hard Red Wheat Dec 18 529-6s +7-2 +1.39%
Hard Red Wheat Mar 19 544-6s +7-4 +1.40%
Chicago livestock futures in US¢/pound, Pit trade
Live Cattle Apr 18 113.750s -2.250 -1.94%
Live Cattle Jun 18 102.575s -3.000 -2.84%
Live Cattle Aug 18 101.475s -2.975 -2.85%
Feeder Cattle Mar 18 135.600s -0.375 -0.28%
Feeder Cattle Apr 18 133.325s -4.500 -3.27%
Feeder Cattle May 18 134.025s -4.475 -3.23%
Lean Hogs Apr 18 57.250s +0.325 +0.57%
Lean Hogs May 18 67.825s +0.500 +0.74%
Lean Hogs Jun 18 76.550s -0.075 -0.10%