
 Canola rose Thursday on the Statistics Canada report that showed farmers expect to seed a surprisingly small canola acreage and on technical factors.
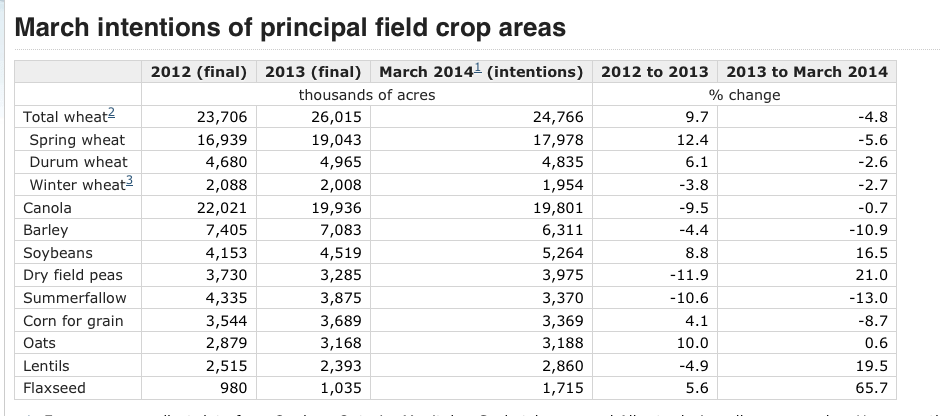
StatsCan’s farmer survey showed canola planting intentions at 19.801 million acres, versus trade expectations for 21.1 million acres.
It would be the third largest area ever, following the record of 22 million set in 2012 and last year’s 19.935 million.
Read Also
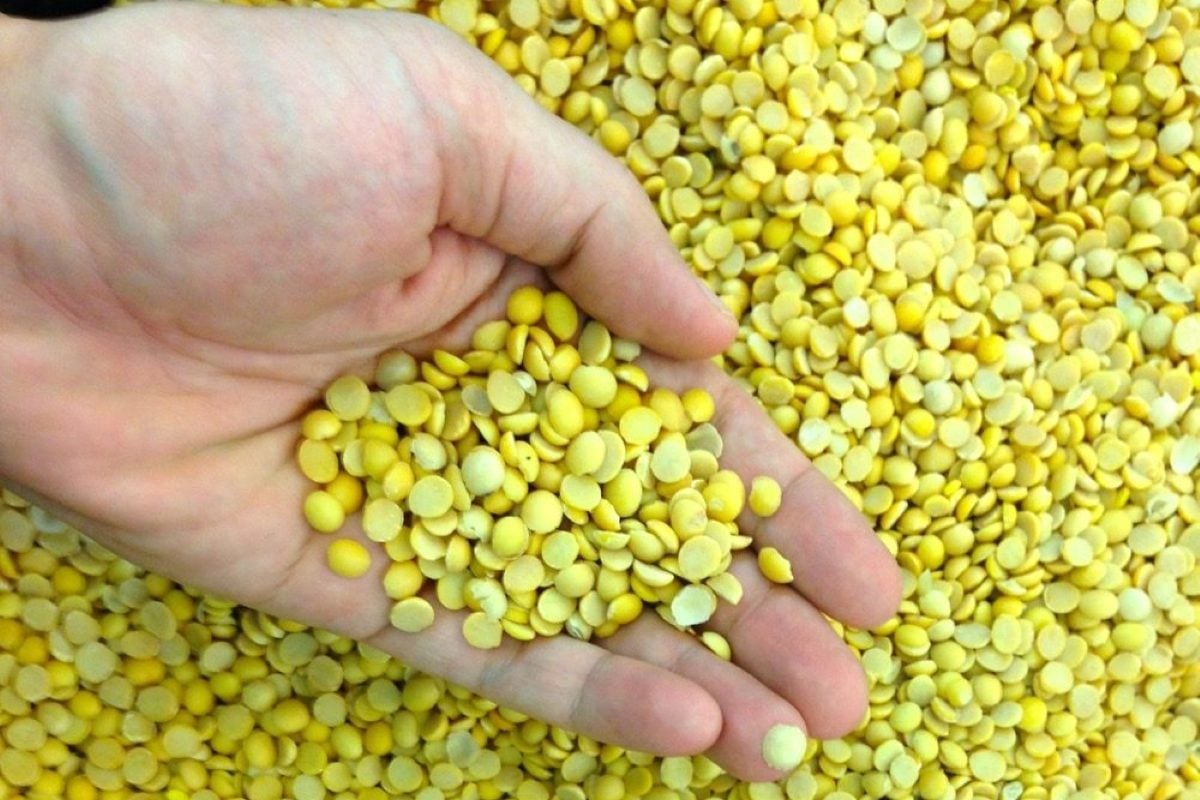
Pulse Weekly: India imposes 30 per cent tariff on yellow peas
Pulse Canada is quite unhappy with the Indian government’s recent move to slap a 30 per cent tariff on its yellow pea imports, said the pulse organization’s board chair Terry Youzwa.
The StatsCan report showed farmers intend to seed less wheat, canola and barley and more peas, lentils, flax and soybeans.
Canola gained technical strength when the May contract bounced back off the $445 mark. Slightly stronger soybeans and soy oil, lifted by bargain buying, also supported canola.
Although the somewhat bullish StatsCan report was about new crop, it was old crop May that rose the most, closing at $452.40, up $6.60. November closed at $473.60, up $3.70.
More on the StatsCan report later.
Wheat rose on rising tensions in Ukraine and a U.S. drought map that shows dryness still grips western regions of the southern plains. Rain in the past few days was centered in eastern Nebraska, northern Kansas and southeastern Oklahoma. Western parts of Kansas, Oklahoma and Texas got little relief from the drought.
Corn fell on profit taking. Weekly export sales were in line with expectations.
Losses in corn were limited by concerns about the slow start to seeding in the Midwest. A lot of rain is expected over the next five days in the Midwest.
Word from Europe is that the canola crop there is doing well and production should top last year’s crop, although the increase is unlikely to be great.
The harvest is forecast reach 21.09 million tonnes, up from 20.84 million in 2013, according to German trading house Toepfer International. French consultancy ODA sees 21.35 million tonnes and Strategie Grains 21.55 million.
Winter rapeseed in Europe is now flowering, about two weeks ahead of normal.
The Indian Meteorological Department’s first monsoon forecast for the year issued today was in line with the outlook of the World Meteorological Organization that predicted mostly below-average rains in much of South Asia, including India.
If it turns out true, it could lead to good demand for the large pulse crop expected from Canada.
Also supporting lentil prices are signs that drought and spring frost in Turkey could have harmed lentils there.
Turning back to the StatsCan report, the survey showed another big increase in expected soybean acreage on the Prairies.
It sees Manitoba soybean area climbing to 1.3 million acres, up 24 percent.
Saskatchewan seeded area is seen climbing to 300,000 acres, a 76 percent increase.
Manitoba’s corn areas are seen falling to 300,000 acres, down from 380,000 last year.
Manitoba’s sunflower area is seen climbing to 125,000 acres, up from 70,000 last year.
The decline in canola area is a Saskatchewan event. Farmers there said they’d drop area to 10.3 million acres, from 10.5 million last year.
Alberta expects a 100,000 acre increase to 6.18 million while Manitoba growers expect to keep their number about steady at 3.15 million.
Canadian spring wheat area is expected to fall 5.6 percent to 17.978 million acres, and durum is expected to fall 2.7 percent to 4.835 million.
Barley area is expected to fall almost 11 percent to 6.311 million acres.
Oats will likely change only a little, rising 0.6 percent to 3.188 million aces, while flax is expected to soar almost 66 percent to 1.715 million acres.
Summerfallow is expected to be a record low of 3.37 million acres.
The survey was conducted March 24-31 with about 11,500 farmers.
Winnipeg ICE Futures Canada dollars per tonne
Canola May 2014 452.40 +6.60 +1.48%
Canola Jul 2014 460.10 +5.40 +1.19%
Canola Nov 2014 473.60 +3.70 +0.79%
Canola Jan 2015 480.40 +3.50 +0.73%
Canola Mar 2015 486.70 +3.40 +0.70%
Milling Wheat May 2014 222.00 +5.00 +2.30%
Milling Wheat Jul 2014 221.00 +5.00 +2.31%
Milling Wheat Oct 2014 223.00 +5.00 +2.29%
Durum Wheat May 2014 250.00 unch 0.00%
Durum Wheat Jul 2014 250.00 unch 0.00%
Durum Wheat Oct 2014 252.00 unch 0.00%
Barley May 2014 139.50 unch 0.00%
Barley Jul 2014 140.50 unch 0.00%
Barley Oct 2014 140.50 unch 0.00%
American crop prices in cents US/bushel, soybean meal in $US/short ton, soy oil in cents US/pound
Chicago
Soybeans May 2014 1472 +3.5 +0.24%
Soybeans Jul 2014 1470 +5.25 +0.36%
Soybeans Aug 2014 1409.5 +9 +0.64%
Soybeans Sep 2014 1290.25 +4.75 +0.37%
Soybeans Nov 2014 1231 +3.5 +0.29%
Soybeans Jan 2015 1236.75 +3.75 +0.30%
Soybean Meal May 2014 480.2 +2.1 +0.44%
Soybean Meal Jul 2014 470.7 +1.7 +0.36%
Soybean Meal Aug 2014 446.4 +2.8 +0.63%
Soybean Oil May 2014 42.59 +0.09 +0.21%
Soybean Oil Jul 2014 42.86 +0.08 +0.19%
Soybean Oil Aug 2014 42.8 +0.11 +0.26%
Corn May 2014 501.25 -2.25 -0.45%
Corn Jul 2014 507.25 -2.25 -0.44%
Corn Sep 2014 505 -2.25 -0.44%
Corn Dec 2014 502.75 -1.75 -0.35%
Corn Mar 2015 510.75 -1.75 -0.34%
Oats May 2014 401.75 -7.25 -1.77%
Oats Jul 2014 355.5 -4.5 -1.25%
Oats Sep 2014 347 -1.75 -0.50%
Oats Dec 2014 336.5 -1 -0.30%
Oats Mar 2015 336.25 -0.5 -0.15%
Wheat May 2014 689 +12.5 +1.85%
Wheat Jul 2014 696.5 +13.75 +2.01%
Wheat Sep 2014 705.5 +13.75 +1.99%
Wheat Dec 2014 719.75 +14 +1.98%
Wheat Mar 2015 732.75 +14 +1.95%
Minneapolis
Spring Wheat May 2014 736.25 +12 +1.66%
Spring Wheat Jul 2014 739.5 +12.75 +1.75%
Spring Wheat Sep 2014 746.5 +12.5 +1.70%
Spring Wheat Dec 2014 757 +13 +1.75%
Spring Wheat Mar 2015 766 +14.25 +1.90%
Kansas City
KC HRW Wheat May 2014 759.5 +13.75 +1.84%
KC HRW Wheat Jul 2014 765.5 +15 +2.00%
KC HRW Wheat Sep 2014 771.75 +14.25 +1.88%
KC HRW Wheat Dec 2014 782 +13.75 +1.79%
KC HRW Wheat Mar 2015 785.75 +14 +1.81%
Light crude oil nearby futures in New York rose 50 cents at $101.94 US per barrel.
The Canadian dollar at noon was 90.69 cents US, up slightly from 90.65 cents the previous trading day. The U.S. dollar at noon was $1.1027 Cdn.
Stock markets were supported by positive earnings reports from companies such as Apple, Microsoft and Potash Corp., but worries about the crisis in Ukraine limited gains.
The Toronto Stock Exchange’s S&P/TSX composite index rose 20.86 points, or 0.14 percent, at 14,554.25.
The Dow Jones industrial average remained unchanged to close at 16,501.65.
The S&P 500 gained 3.22 points or 0.17 percent, to 1,878.61.
The Nasdaq Composite added 21.372 points or 0.52 percent, to end at 4,148.338.


