


Crop futures markets were mostly steady Monday as counterbalancing weather impacts left the situation mostly unchanged.
Frost hit some crops in the U.S. northern Midwest, reaching from northern Iowa up northwest to the Canadian border, but damage is not expected to be severe.
The damage from the western Canadian frosts of last week also remains to be seen, but its potential clearly wasn’t worrying markets Monday.
Crop seeding continues.
November canola futures remain in the $510 per tonne zone they have recently settled around. Whether there is another leg up remains to be seen.
Read Also
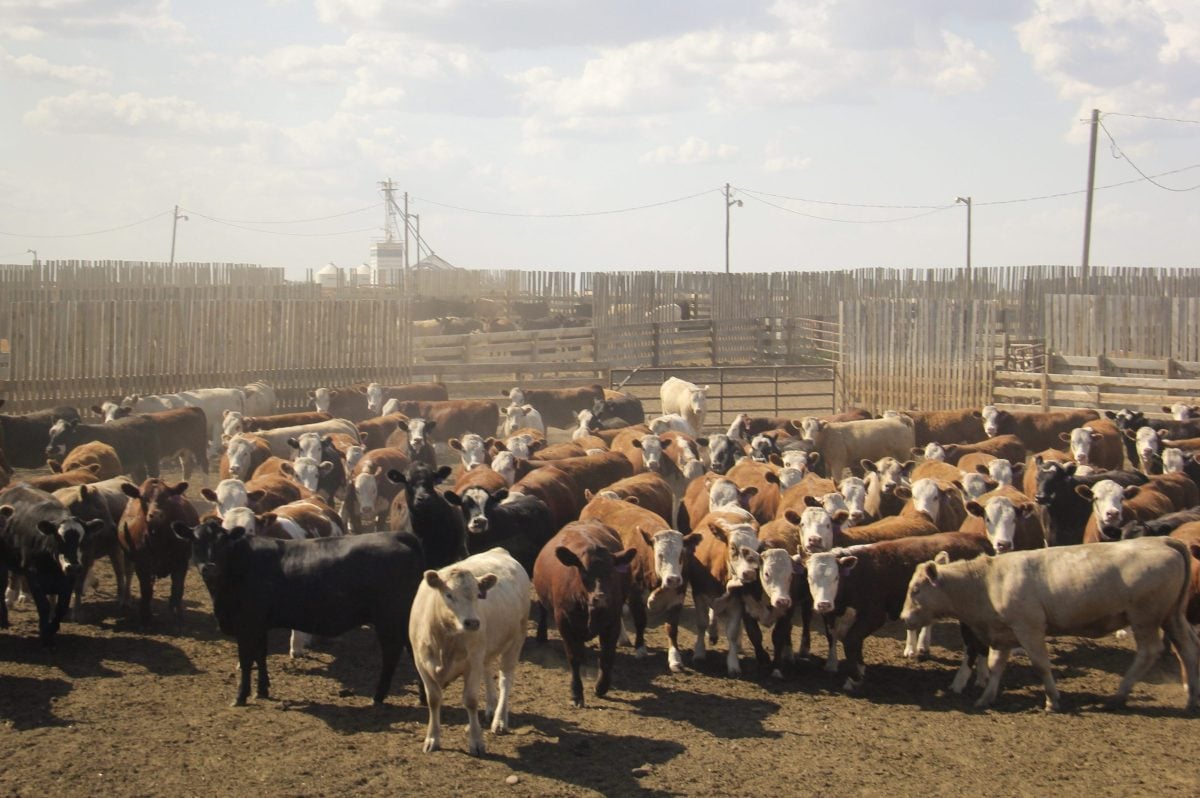
U.S. livestock: Hog futures hit contract highs on shock herd decline
Chicago | Reuters – Lean hog futures stormed to contract highs at the Chicago Mercantile Exchange on Friday as smaller-than-expected…
Rain is in the forecast for dry parts of Alberta late this week and early next week.
Ukrainian wheat looks better than expected.
Contact ed.white@producer.com
After markets closed, the U.S. Department of Agriculture’s weekly crop progress report pegged U.S. corn and soybean planting as of May 15 at 75 and 36 percent complete respectively, slightly less advanced than expected on average.
U.S. spring wheat sowing was 89 percent done, also slightly behind expectations.
Light crude oil nearby futures in New York were up $1.51 to US$47.72 per barrel.
The Canadian dollar at noon was US77.60 cents, up from 77.28 cents the previous trading day. The U.S. dollar at noon was C$1.2887.
Winnipeg ICE Futures Canada dollars per tonne
Canola Jul 2016 515.90 +0.10 +0.02%
Canola Jan 2017 516.70 -0.20 -0.04%
Canola Mar 2017 517.30 +0.30 +0.06%
Canola May 2017 517.50 +1.60 +0.31%
Milling Wheat Jul 2016 238.00 +2.00 +0.85%
Milling Wheat Oct 2016 235.00 +2.00 +0.86%
Milling Wheat Dec 2016 239.00 +2.00 +0.84%
Durum Wheat Jul 2016 297.00 unch 0.00%
Durum Wheat Oct 2016 291.00 unch 0.00%
Durum Wheat Dec 2016 293.00 unch 0.00%
Barley Jul 2016 174.00 unch 0.00%
Barley Oct 2016 174.00 unch 0.00%
Barley Dec 2016 174.00 unch 0.00%
American crop prices in cents US/bushel, soybean meal in $US/short ton, soy oil in cents US/pound
Chicago
Soybeans Jul 2016 1064.5 -0.5 -0.05%
Soybeans Aug 2016 1066.75 -0.25 -0.02%
Soybeans Sep 2016 1059.5 unch 0.00%
Soybeans Nov 2016 1055 +0.5 +0.05%
Soybeans Jan 2017 1053.75 +2 +0.19%
Soybeans Mar 2017 1034.25 +4.25 +0.41%
Soybean Meal Jul 2016 361.2 -1.8 -0.50%
Soybean Meal Aug 2016 358.7 -2.3 -0.64%
Soybean Meal Sep 2016 357.2 -2.5 -0.70%
Soybean Oil Jul 2016 32.79 +0.29 +0.89%
Soybean Oil Aug 2016 32.9 +0.29 +0.89%
Soybean Oil Sep 2016 33.02 +0.3 +0.92%
Corn Jul 2016 394 +3.25 +0.83%
Corn Sep 2016 396 +2.75 +0.70%
Corn Dec 2016 400 +1.75 +0.44%
Corn Mar 2017 408.25 +2.25 +0.55%
Corn May 2017 412.25 +2 +0.49%
Oats Jul 2016 197 +1.75 +0.90%
Oats Sep 2016 207.5 +0.75 +0.36%
Oats Dec 2016 219 +0.25 +0.11%
Oats Mar 2017 228.5 +0.75 +0.33%
Oats May 2017 228.5 +0.75 +0.33%
Wheat Jul 2016 474.75 unch 0.00%
Wheat Sep 2016 484 unch 0.00%
Wheat Dec 2016 499 -0.25 -0.05%
Wheat Mar 2017 513.75 +0.5 +0.10%
Wheat May 2017 522.25 +0.75 +0.14%
Minneapolis
Spring Wheat Jul 2016 537.25 +1.75 +0.33%
Spring Wheat Sep 2016 544.25 +2 +0.37%
Spring Wheat Dec 2016 555.5 +1.25 +0.23%
Spring Wheat Mar 2017 564 +1 +0.18%
Spring Wheat May 2017 569.5 +1 +0.18%
Kansas City
Hard Red Wheat Jul 2016 453.5 -2.5 -0.55%
Hard Red Wheat Sep 2016 469.75 -3 -0.63%
Hard Red Wheat Dec 2016 494 -3 -0.60%
Hard Red Wheat Mar 2017 510.5 -2.5 -0.49%
Hard Red Wheat May 2017 520.75 -2.25 -0.43%


