Canola had a strong day Monday, rising $8.80 per tonne for the May contract and $5.40 for November.
May canola settled at $508.80, giving it some breathing space from the $500 mark it settled at on Friday.
New crop November is well back, at $485.90.
The spread between old and new crop futures prices reveals the reality of extremely tight old crop stocks and the expectations of bigger crops and a well-supplied vegetable oil crop market for the 2017-18 crop year.
“Canola continued to trade very strong as it has done for a while now,” said Ken Ball of P.I. Financial.
Read Also
Grain trader Bunge lowers 2025 profit forecast after closing Viterra deal
U.S. grain trader and processor Bunge on Wednesday lowered its 2025 earnings forecast following its merger with Viterra, and said it is overhauling segment and volume reporting to align with its integrated operations.
Soybean oil rose too, strengthening after a run of recent losses.
“It was due a bit of a bounce,” Ball said.
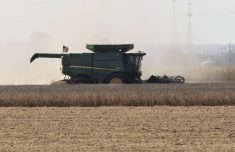
Canola prices were also strengthened by cold, wet weather on the Canadian Prairies, which hurt western farmers’ attempts and hopes to harvest hundreds of thousands of acres of canola left in the field last fall.
Some reports of farmers managing to harvest 30-plus bushels per acre had weakened the canola price outlook, but the poor weekend weather reversed that. Many fields are saturated from last fall and this new moisture won’t help.
Soybean prices weakened Monday, even as soybean oil surged. A slower U.S. soybean crush in March, well short of expectations, damaged the outlook.
Soybean meal prices were weak, leading soybeans’ fall.
Wheat contracts were weaker Monday. The outlook for the U.S. winter wheat crop is improving thanks to improved soil moisture from recent rains.
The American market is watching to see how much rain falls in the Midwest this year and how much that holds back the pace of spring seeding.
OUTSIDE MARKETS
Light crude oil nearby futures in New York were down 53 cents to US$52.65 per barrel.
In the afternoon, the Canadian dollar was trading around US75.09 cents, up from 74.99 cents the previous trading day. The U.S. dollar was C$1.3317.
The Toronto Stock Exchange’s S&P/TSX composite index ended up 149.41 points, or 0.96 percent, at 15,684.89.
The Dow Jones Industrial Average rose 183.67 points, or 0.9 percent, to 20,636.92, the S&P 500 gained 20.06 points, or 0.86 percent, to 2,349.01 and the Nasdaq Composite added 51.64 points, or 0.89 percent, to 5,856.79.
Winnipeg ICE Futures Canada dollars per tonne
Canola May 2017 508.80 +8.80 +1.76%
Canola Jul 2017 506.30 +7.30 +1.46%
Canola Nov 2017 485.90 +5.40 +1.12%
Canola Jan 2018 489.40 +5.90 +1.22%
Canola Mar 2018 493.00 +6.20 +1.27%
Milling Wheat May 2017 226.00 -2.00 -0.88%
Milling Wheat Jul 2017 229.00 unch 0.00%
Milling Wheat Oct 2017 224.00 -1.00 -0.44%
Durum Wheat May 2017 268.00 -3.00 -1.11%
Durum Wheat Jul 2017 270.00 -1.00 -0.37%
Durum Wheat Oct 2017 263.00 unch 0.00%
Barley May 2017 137.00 unch 0.00%
Barley Jul 2017 138.00 unch 0.00%
Barley Oct 2017 140.00 unch 0.00%
American crop prices in cents US/bushel, soybean meal in $US/short ton, soy oil in cents US/pound
Chicago
Soybeans May 2017 953.25 -4.00 -0.42%
Soybeans Jul 2017 963.75 -4.50 -0.46%
Soybeans Aug 2017 965.50 -3.50 -0.36%
Soybeans Sep 2017 963.50 -2.50 -0.26%
Soybeans Nov 2017 962.25 -1.25 -0.13%
Soybeans Jan 2018 968.75 -0.75 -0.08%
Soybean Meal May 2017 313.40 -4.70 -1.48%
Soybean Meal Jul 2017 317.70 -4.50 -1.40%
Soybean Meal Aug 2017 318.40 -4.20 -1.30%
Soybean Oil May 2017 31.80 +0.52 +1.66%
Soybean Oil Jul 2017 32.03 +0.54 +1.71%
Soybean Oil Aug 2017 32.14 +0.55 +1.74%
Corn May 2017 366.50 -4.25 -1.15%
Corn Jul 2017 373.25 -4.50 -1.19%
Corn Sep 2017 380.00 -4.25 -1.11%
Corn Dec 2017 390.25 -4.00 -1.01%
Corn Mar 2018 399.75 -4.25 -1.05%
Oats May 2017 219.25 -6.25 -2.77%
Oats Jul 2017 218.50 -5.75 -2.56%
Oats Sep 2017 216.25 -4.75 -2.15%
Oats Dec 2017 218.50 -5.25 -2.35%
Oats Mar 2018 225.75 -5.00 -2.17%
Wheat May 2017 421.00 -8.25 -1.92%
Wheat Jul 2017 435.75 -7.00 -1.58%
Wheat Sep 2017 449.50 -6.25 -1.37%
Wheat Dec 2017 470.00 -6.50 -1.36%
Wheat Mar 2018 487.25 -6.25 -1.27%
Minneapolis
Spring Wheat May 2017 528.75 -1.25 -0.24%
Spring Wheat Jul 2017 537.50 -1.50 -0.28%
Spring Wheat Sep 2017 545.50 -2.50 -0.46%
Spring Wheat Dec 2017 556.50 -2.25 -0.40%
Spring Wheat Mar 2018 567.00 -0.50 -0.09%
Kansas City
Hard Red Wheat May 2017 416.25 -11.50 -2.69%
Hard Red Wheat Jul 2017 429.00 -10.50 -2.39%
Hard Red Wheat Sep 2017 445.00 -11.00 -2.41%
Hard Red Wheat Dec 2017 470.25 -10.75 -2.23%
Hard Red Wheat Mar 2018 487.25 -10.50 -2.11%
Chicago livestock futures in US¢/pound (rounded to two decimal places)
Live Cattle (P) Apr 2017 126.43 +0.98 +0.78%
Live Cattle (P) Jun 2017 115.58 +0.88 +0.77%
Live Cattle (P) Aug 2017 111.55 +0.75 +0.68%
Feeder Cattle (P) Apr 2017 139.05 +1.35 +0.98%
Feeder Cattle (P) May 2017 140.15 +1.87 +1.35%
Feeder Cattle (P) Aug 2017 142.22 +1.92 +1.37%
Lean Hogs (P) Apr 2017 61.98 -0.52 -0.83%
Lean Hogs (P) May 2017 67.72 -0.58 -0.85%
Lean Hogs (P) Jun 2017 72.35 -0.30 -0.41%