Canola drifted a few pennies a bushel lower on Thursday reflecting an overall weak crop market.
July canola rallied early in the session, climbing as high as $496.20 but closed at $488.60 a tonne, down $1.30 from Wednesday’s close.
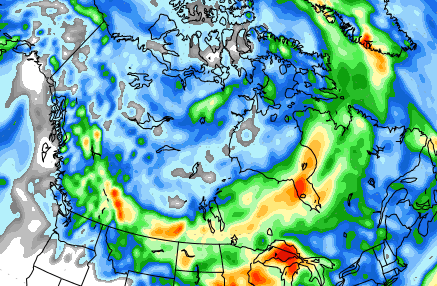
Canola fell even as weather forecasts were conflicting on rain in the near term, the loonie weakened and farmers in France complained about dry weather sapping their rapeseed yields.
There is a thunderstorm watch in central Alberta and western Saskatchewan today but forecasted accumulations are around only 5 millimetres. Yesterday there was some light rain around Red Deer, Alta., and in southwestern Saskatchewan near the U.S. border.
Read Also

U.S. livestock: Cattle fall sharply as Trump says he’s working to lower beef costs
Chicago cattle futures fell sharply on Friday after U.S. President Donald Trump said his administration was working to lower the…
Other than thundershowers, the outlook for this weekend and early next week appears to be turning drier.
However, longer term, the forecast from the Center for Ocean, Land, Atmosphere Studies for June 19 through June 27 shows the potential for accumulations of around two inches in much of the southern grain belt. But yields will likely be significantly compromised by then.
Here is a link to long term forecasts from the Center for Ocean-Land-Atmosphere Studies.
Be aware that Saskatchewan crop insurance has a series of deadlines June 21-25 for various coverage types.
Soy oil fell as it retreats from the rally caused by the new mandates for U.S. biodiesel and on weaker palm oil.
Reuters reported data from the Malaysian Palm Oil Board showed palm oil stocks last month swelled to their highest since November to stand at 2.24 million tonnes, overturning expectations that robust export demand would dent inventories.
U.S. wheat futures extended losses to the lowest levels in a week, pressured by gains in the American dollar and after the U.S. Department of Agriculture on Wednesday raised its U.S. winter wheat crop outlook and year end stocks forecast.
Soybeans and corn also dipped on the stronger U.S. buck. The dollar climbed as a surge in U.S. retail sales led to speculation the Federal Reserve could boost interest rates by September.
Top wheat importer Egypt bought 60,000 tonnes of wheat from Russia, providing fresh evidence that U.S. grain is uncompetitive in many global destinations.
“There’s no bullish news out there,” Futures International analyst Terry Reilly, told Reuters.
“The USDA reports were bearish and the dollar being strong is driving it as well.”
USDA in a monthly supply and demand report on Wednesday raised its winter wheat production forecast by 33 million bu. from the previous month, to 1.505 billion bu., as rains late in the growing season lifted yields even as excess precipitation also stoked quality concerns.
However, heavy rain is expected over the coming week in Kansas raising the potential for more crop damage.
Soybeans and corn were further pressured by higher harvest estimates issued by Brazilian government supply agency Conab.
Global grain and oilseed supplies are plentiful, and growing conditions are largely favourable in the United States for the new corn and soybean crops, Reuters reported.
“The theme across the complex is comfortable supplies and a generally benign crop outlook in the U.S. and around the world,” research firm Brock Associates said in a note.
Citing reduced ethanol production, USDA on Wednesday raised its 2015-16 ending stocks estimate for corn to 1.771 billion bu. from 1.746 billion bu. and its 2014-15 ending stocks view to 1.876 billion bu. from 1.851 billion bu.
But it cut soybean ending stocks for the 2015-16 marketing year by 25 million bu. to 475 million bu. For 2014-15, USDA also trimmed soy stocks to 330 million bu. from 350 million bu.
Light crude oil nearby futures in New York were down 66 cents to US$60.77 per barrel.
The Canadian dollar at noon was US81.21 cents, down from 81.52 cents the previous trading day. The U.S. dollar at noon was C$1.2314.
Winnipeg ICE Futures Canada dollars per tonne
Canola Jul 2015 488.60 -1.30 -0.27%
Canola Nov 2015 487.40 -1.50 -0.31%
Canola Jan 2016 484.20 -1.90 -0.39%
Canola Mar 2016 481.30 -1.90 -0.39%
Canola May 2016 478.30 -1.90 -0.40%
Milling Wheat Jul 2015 215.00 -2.00 -0.92%
Milling Wheat Oct 2015 220.00 -2.00 -0.90%
Milling Wheat Dec 2015 220.00 -2.00 -0.90%
Durum Wheat Jul 2015 298.00 unch 0.00%
Durum Wheat Oct 2015 298.00 unch 0.00%
Durum Wheat Dec 2015 303.00 unch 0.00%
Barley Jul 2015 205.00 unch 0.00%
Barley Oct 2015 200.00 unch 0.00%
Barley Dec 2015 205.00 unch 0.00%
American crop prices in cents US/bushel, soybean meal in $US/short ton, soy oil in cents US/pound
Chicago
Soybeans Jul 2015 940 -9.5 -1.00%
Soybeans Aug 2015 922.75 -12 -1.28%
Soybeans Sep 2015 911.25 -12.25 -1.33%
Soybeans Nov 2015 908.75 -13 -1.41%
Soybeans Jan 2016 915.75 -13.25 -1.43%
Soybeans Mar 2016 919.5 -14 -1.50%
Soybean Meal Jul 2015 313.4 -1 -0.32%
Soybean Meal Aug 2015 305.7 -1 -0.33%
Soybean Meal Sep 2015 301 -1.3 -0.43%
Soybean Oil Jul 2015 33.29 -0.58 -1.71%
Soybean Oil Aug 2015 33.33 -0.58 -1.71%
Soybean Oil Sep 2015 33.39 -0.57 -1.68%
Corn Jul 2015 356.5 -0.75 -0.21%
Corn Sep 2015 363 -1.25 -0.34%
Corn Dec 2015 374.25 -1 -0.27%
Corn Mar 2016 385.75 -0.75 -0.19%
Corn May 2016 392.75 -1 -0.25%
Oats Jul 2015 259.75 +4 +1.56%
Oats Sep 2015 266.25 +4.75 +1.82%
Oats Dec 2015 270.5 +3 +1.12%
Oats Mar 2016 277.25 +3 +1.09%
Oats May 2016 284 +3 +1.07%
Wheat Jul 2015 504.25 -9.25 -1.80%
Wheat Sep 2015 511.5 -9.75 -1.87%
Wheat Dec 2015 525.5 -9.5 -1.78%
Wheat Mar 2016 537.75 -10 -1.83%
Wheat May 2016 546.25 -10.25 -1.84%
Minneapolis
Spring Wheat Jul 2015 562.75 -4.25 -0.75%
Spring Wheat Sep 2015 572.25 -4.75 -0.82%
Spring Wheat Dec 2015 584.25 -5.25 -0.89%
Spring Wheat Mar 2016 597.5 -5.25 -0.87%
Spring Wheat May 2016 606.25 -5.25 -0.86%
Kansas City
Hard Red Wheat Jul 2015 523.25 -7.25 -1.37%
Hard Red Wheat Sep 2015 533.5 -7.5 -1.39%
Hard Red Wheat Dec 2015 550.25 -7.25 -1.30%
Hard Red Wheat Mar 2016 563.25 -7.5 -1.31%
Hard Red Wheat May 2016 571.75 -7.75 -1.34%