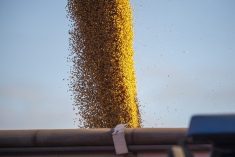
Crop futures surged Monday, giving life to farmer hopes that the bearish back of the market might have been broken.
Crop futures generally rose almost 2.5 percent on the day, with soybeans and its components rallying more than three percent. Corn rose almost three percent, oats rose almost two and a half percent, canola rose two and a third percent and spring wheat rose about one and a half percent.
Fundamental factors for the bullish move included strong export numbers and especially slow progress on U.S. harvest in the last week and a forecast of more rain to come.
Read Also
Expana lifts EU cereal forecasts, maize exceeds expectations
Expana has raised its monthly grain production forecast for European Union crops for the 2025/26 season, projecting soft wheat output will hit a record high and barley a 17-year high.
Much as Canadian markets have worried about quality damage and yield loss as crops sit in the field vulnerable to inclement autumn weather, U.S. markets are now seeing the same risk with American crops.
Markets might be touchy in the week-long run-up to the release of the U.S. Department of Agriculture World Agricultural Supply and Demand Estimates report of Oct. 10.
Some analysts have already called a market bottom for the grains, but soybeans present a more challenging situation. Reported yields at levels well above previous record levels have made soybeans weaker than grains in recent days, but Monday’s limit-up move in price wasn’t seen by all analysts as necessarily proof that the market bottom has been reached.
“I think the bean market, despite today’s rally, maybe has one more leg down,” said Mike Krueger of the Money Farm in Fargo, North Dakota.
The rally Monday and recent strength in corn and wheat has cheered farmers who had grown used to almost daily drops in price since spring.
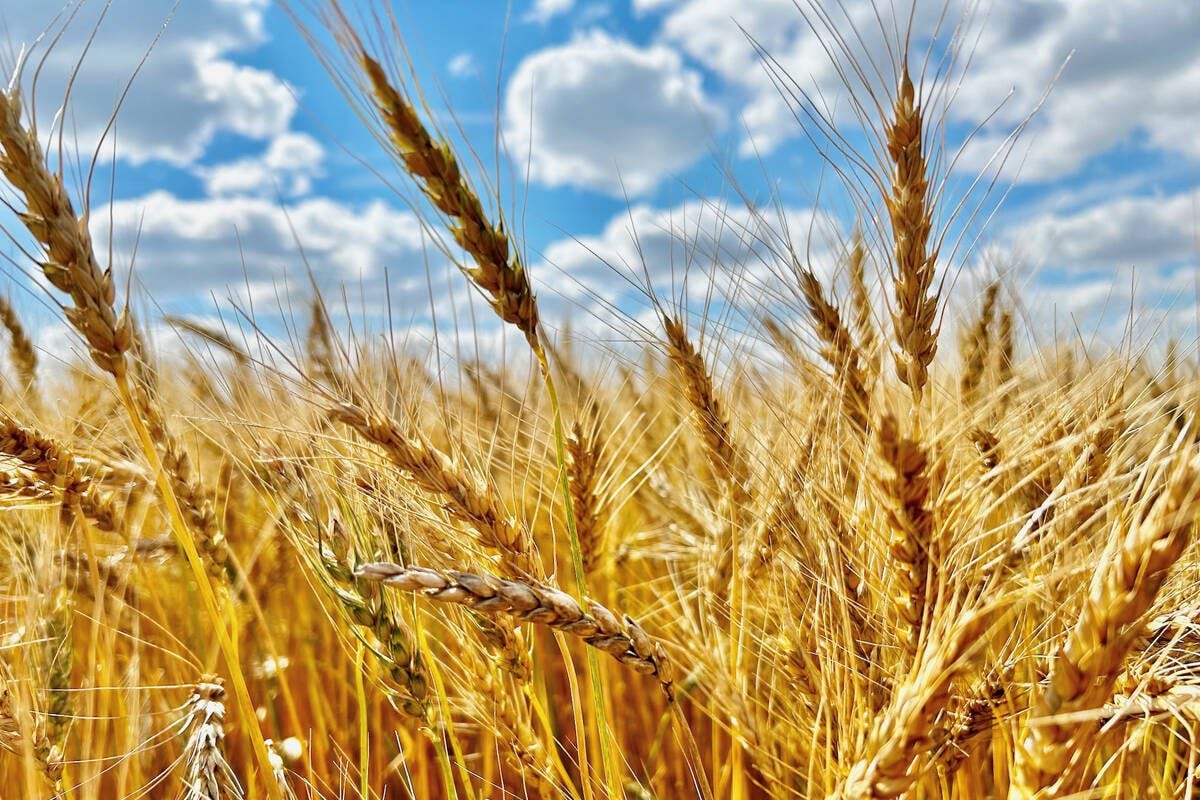
Corn recently hit a low of $3.18 per bushel, a level some farmers thought they wouldn’t see again for years. Wheat futures adventures below the $6 per bu. level have dispirited thousands of growers, many of whom have damaged crops that will be fetch cash discountes well below the futures.
However much the Friday report affects analyst outlooks, Damiani thinks for the grains at least, little is likely to drive them lower.
“My bias is that we’ve settled into a trading range,” said Damiani.
“We’ve seen the lows.”
Winnipeg ICE Futures Canada dollars per tonne
Canola Nov 2014 413.30 +9.50 +2.35%
Canola Jan 2015 419.60 +9.70 +2.37%
Canola Mar 2015 426.50 +9.90 +2.38%
Canola Jul 2015 436.80 +8.70 +2.03%
Milling Wheat Oct 2014 206.00 +4.00 +1.98%
Milling Wheat Dec 2014 211.00 +5.00 +2.43%
Milling Wheat Mar 2015 220.00 +4.00 +1.85%
Durum Wheat Oct 2014 320.00 unch 0.00%
Durum Wheat Dec 2014 326.50 unch 0.00%
Durum Wheat Mar 2015 327.50 unch 0.00%
Barley Oct 2014 114.50 unch 0.00%
Barley Dec 2014 116.50 unch 0.00%
Barley Mar 2015 119.50 unch 0.00%
American crop prices in cents US/bushel, soybean meal in $US/short ton, soy oil in cents US/pound
Chicago
Soybeans Nov 2014 942.25 +30 +3.29%
Soybeans Jan 2015 950.5 +30 +3.26%
Soybeans Mar 2015 958.25 +29.75 +3.20%
Soybeans May 2015 964.5 +29 +3.10%
Soybeans Jul 2015 969.75 +28.5 +3.03%
Soybeans Aug 2015 972 +28 +2.97%
Soybean Meal Oct 2014 320.3 +12.3 +3.99%
Soybean Meal Dec 2014 308.9 +10.1 +3.38%
Soybean Meal Jan 2015 306.8 +9.4 +3.16%
Soybean Oil Oct 2014 33.32 +1.03 +3.19%
Soybean Oil Dec 2014 33.45 +1.03 +3.18%
Soybean Oil Jan 2015 33.7 +1.02 +3.12%
Corn Dec 2014 332.5 +9.25 +2.86%
Corn Mar 2015 345.25 +9 +2.68%
Corn May 2015 353.75 +8.75 +2.54%
Corn Jul 2015 361.75 +9 +2.55%
Corn Sep 2015 369.75 +9 +2.49%
Oats Dec 2014 350.5 +8.25 +2.41%
Oats Mar 2015 333.5 +7 +2.14%
Oats May 2015 325.75 +8 +2.52%
Oats Jul 2015 319 +6 +1.92%
Oats Sep 2015 321.5 +4.25 +1.34%
Wheat Dec 2014 491.5 +5.75 +1.18%
Wheat May 2015 512.25 +7 +1.39%
Wheat Jul 2015 520.75 +7 +1.36%
Wheat Sep 2015 533.25 +7.75 +1.47%
Minneapolis
Spring Wheat Dec 2014 551.75 +8.25 +1.52%
Spring Wheat Mar 2015 566.75 +8.5 +1.52%
Spring Wheat May 2015 577 +7.75 +1.36%
Spring Wheat Jul 2015 587.75 +8 +1.38%
Spring Wheat Sep 2015 598.75 +7.75 +1.31%
Kansas City
Hard Red Wheat Dec 2014 575.5 +7.5 +1.32%
Hard Red Wheat Mar 2015 575.5 +6.75 +1.19%
Hard Red Wheat May 2015 578.5 +8 +1.40%
Hard Red Wheat Jul 2015 574.75 +8.25 +1.46%
Hard Red Wheat Sep 2015 586.75 +8.25 +1.43%
Light crude oil nearby futures in New York rose 60 cents at $90.34 US per barrel.
The Canadian dollar at noon was 89.49 cents US, up from 88.84 cents the previous trading day. The U.S. dollar at noon was $1.1175 Cdn.
The Toronto Stock Exchange’s S&P/TSX composite index closed down 46.66 points, or 0.32 percent, at 14,743.12.
The Dow Jones industrial average fell 17.78 points, or 0.1 percent, to 16,991.91, the S&P 500 lost 3.08 points, or 0.16 percent, to 1,964.82 and the Nasdaq Composite dropped 20.82 points, or 0.47 percent, to 4,454.8.