Canola closed higher Wednesday with support from soybeans, which were led higher by a very strong soy meal market.
July and November canola closed up almost one percent, but soybeans rose close to three percent, led higher by a 4.7 percent increase in soy meal.
Clearly some meal users are caught short and are worried about increasingly negative reports from Argentina about flood damage to its crop.
Watch our weekly video view of crop markets
Read Also
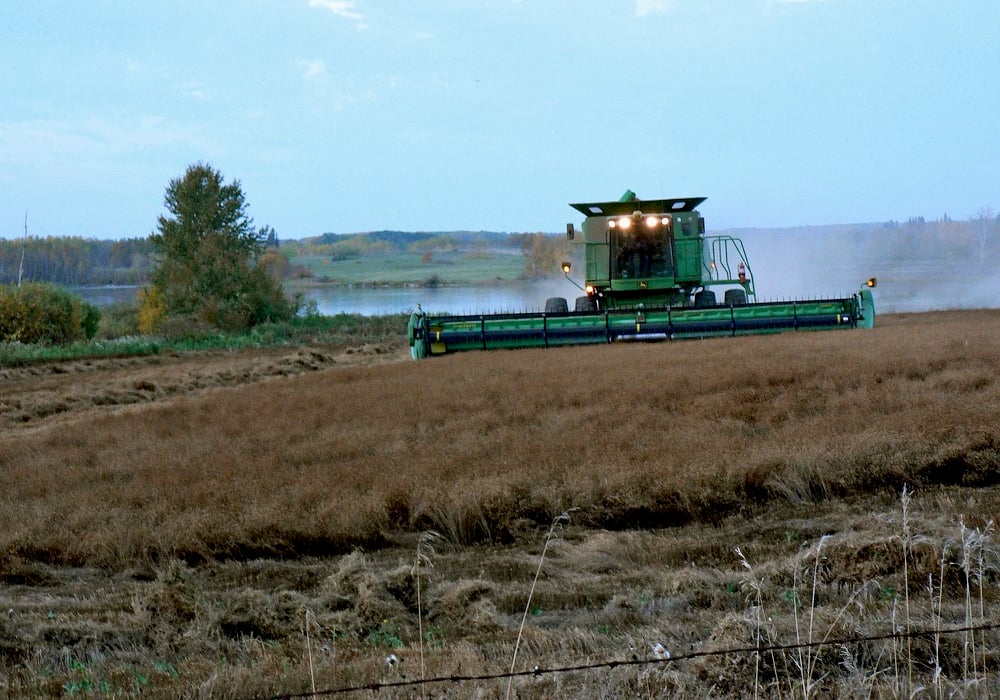
Most of Manitoba harvest wraps up for 2025
Manitoba Agriculture issued its final crop report of 2025, showing the overall provincewide harvest at 97 per cent complete as of Oct. 20. Nearly all major crops have finished combining, with 37 per cent of Manitoba’s sunflowers finished, plus 71 per cent of grain corn and small amounts of soybeans and potatoes left to do.
Analysts in Argentina say the flooding at harvest cut four to eight million tonnes from expected production.
Argentina is the world’s largest soy meal exporter.
Soy meal was also supported by the maintenance temporary shutdown of an Archer Daniels Midland crushing plant in Indiana,
The rally in soy meal has pushed it into oversold territory, raising the potential for a pull back in the price.
The 14-day relative strength index for July meal is 82.1 percent.
Nearby corn futures closed up 1.8 percent following soybeans and also on worries that rain this week in the U.S. Midwest could make it difficult to seed the final corn acres.
Wheat edged up a few cents higher, supported by corn but also on concerns that the rain, which will extend into the hard red winter wheat area, could lead to disease and quality problems in the crop, which is more than 75 percent headed.
Kansas July wheat rose 4.5 cents, Chicago rose two cents and Minneapolis was unchanged.
Light crude oil nearby futures in New York were up 94 cents to US$49.56 per barrel.
The Canadian dollar at noon was US76.39 cents, up from 76.23 cents the previous trading day. The U.S. dollar at noon was C$1.3090.
The Toronto Stock Exchange’s S&P/TSX composite index closed up 100.89 points, or 0.72 percent, at 14,053.74. It touched its highest since August 19 at 14,093.29.
The index has rallied 22 percent from its low in January.
The Dow Jones industrial average added 0.82 percent to end at 17,851.51 points and the S&P 500 gained 0.7 percent to 2,090.54.
The Nasdaq Composite climbed 0.7 percent to 4,894.89.
Winnipeg ICE Futures Canada dollars per tonne
Canola Jul 2016 524.80 +5.00 +0.96%
Canola Nov 2016 521.80 +4.90 +0.95%
Canola Jan 2017 523.80 +3.60 +0.69%
Canola Mar 2017 524.40 +3.80 +0.73%
Canola May 2017 524.70 +3.40 +0.65%
Milling Wheat Jul 2016 238.00 unch 0.00%
Milling Wheat Oct 2016 233.00 unch 0.00%
Milling Wheat Dec 2016 238.00 unch 0.00%
Durum Wheat Jul 2016 305.00 +1.00 +0.33%
Durum Wheat Oct 2016 297.00 +1.00 +0.34%
Durum Wheat Dec 2016 299.00 +1.00 +0.34%
Barley Jul 2016 171.00 unch 0.00%
Barley Oct 2016 171.00 unch 0.00%
Barley Dec 2016 171.00 unch 0.00%
American crop prices in cents US/bushel, soybean meal in $US/short ton, soy oil in cents US/pound
Chicago
Soybeans Jul 2016 1085.5 +30.75 +2.92%
Soybeans Aug 2016 1081.75 +28.75 +2.73%
Soybeans Sep 2016 1065.5 +26 +2.50%
Soybeans Nov 2016 1054.25 +25 +2.43%
Soybeans Jan 2017 1048.75 +22.25 +2.17%
Soybeans Mar 2017 1025.75 +16.25 +1.61%
Soybean Meal Jul 2016 407.2 +18.3 +4.71%
Soybean Meal Aug 2016 390.4 +14 +3.72%
Soybean Meal Sep 2016 379.3 +9.7 +2.62%
Soybean Oil Jul 2016 31.34 +0.45 +1.46%
Soybean Oil Aug 2016 31.46 +0.44 +1.42%
Soybean Oil Sep 2016 31.6 +0.47 +1.51%
Corn Jul 2016 404.75 +7.25 +1.82%
Corn Sep 2016 407.25 +7.25 +1.81%
Corn Dec 2016 408.5 +5.75 +1.43%
Corn Mar 2017 415.25 +5.75 +1.40%
Corn May 2017 417.75 +5.5 +1.33%
Oats Jul 2016 190 +1.25 +0.66%
Oats Sep 2016 202.5 +1.25 +0.62%
Oats Dec 2016 216.25 unch 0.00%
Oats Mar 2017 225.5 unch 0.00%
Oats May 2017 225.5 unch 0.00%
Wheat Jul 2016 466 +2 +0.43%
Wheat Sep 2016 477.25 +2.25 +0.47%
Wheat Dec 2016 495 +1.75 +0.35%
Wheat Mar 2017 512.25 +1.75 +0.34%
Wheat May 2017 521.75 +2.5 +0.48%
Minneapolis
Spring Wheat Jul 2016 522 unch 0.00%
Spring Wheat Sep 2016 529.75 -0.25 -0.05%
Spring Wheat Dec 2016 542 +0.25 +0.05%
Spring Wheat Mar 2017 553 unch 0.00%
Spring Wheat May 2017 560 +1 +0.18%
Kansas City
Hard Red Wheat Jul 2016 451 +4.5 +1.01%
Hard Red Wheat Sep 2016 466.75 +4 +0.86%
Hard Red Wheat Dec 2016 489.75 +3.25 +0.67%
Hard Red Wheat Mar 2017 505.75 +3 +0.60%
Hard Red Wheat May 2017 515.5 +3 +0.59%