
Canola futures largely marked time on Thursday along with the rest of the crop market.
Little has changed in the overall perception of large crop production in many parts of the world. Private analysts are raising their U.S. yield forecasts.
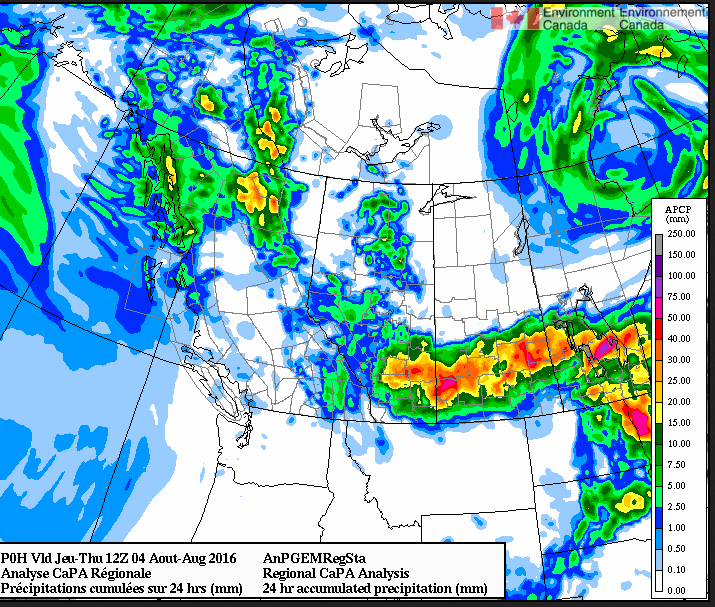
In Western Canada there were large accumulations of rain from a system that started dumping moisture Tuesday in Alberta and moved west across central Saskatchewan. Today it is in Manitoba.
The moisture will heighten the conditions favourable for disease development.
Click here for our weekly video analysis of crop markets.
Canola got a bit of support today from Chicago soyoil futures which rose for a third straight session, buoyed by oil/meal spreading and spillover strength from crude oil.
Read Also

Canadian trade data delayed by U.S. government shutdown
Canadian international trade data for September will be delayed indefinitely due to the ongoing partial shutdown of the United States government, Statistics Canada said Friday, Oct. 24.
Soybeans were steady to slightly higher.
Corn fell about four cents a bushel.
Commodity brokerage Linn & Associates on Wednesday forecast U.S. corn production at 14.775 billion bushels, a record high if realized, with an average yield of 171.4 bu. per acre.
Earlier in the week INTL FCStone forecast a corn crop of 15.146 billion bushels, with an even higher record-high yield of 175 bu. per acre.
The current USDA forecast is 14.54 billion bu. and a yield of 168 bu. an acre.
Linn projected U.S. 2016 soybean production at 4.073 billion bu., a record high if realized, with an average yield of 48.6 bu. per acre.
FCStone forecast 48.8 bu. per acre about two bushels higher than the current USDA forecast of 46.7.
The USDA will update its supply and demand forecasts on Aug. 12.
Light crude oil nearby futures in New York were up $1.10 to US$41.93 per barrel.
The Canadian dollar at noon was US76.78 cents, up from 76.45 cents the previous trading day. The U.S. dollar at noon was C$1.3025.
Winnipeg ICE Futures Canada dollars per tonne
Canola Nov 2016 446.90 +0.90 +0.20%
Canola Jan 2017 453.50 +1.40 +0.31%
Canola Mar 2017 460.10 +1.40 +0.31%
Canola May 2017 466.50 +1.90 +0.41%
Canola Jul 2017 472.30 +2.30 +0.49%
Milling Wheat Oct 2016 205.00 -1.00 -0.49%
Milling Wheat Dec 2016 208.00 -2.00 -0.95%
Durum Wheat Oct 2016 260.00 unch 0.00%
Durum Wheat Dec 2016 263.00 unch 0.00%
Barley Oct 2016 138.00 unch 0.00%
Barley Dec 2016 138.00 unch 0.00%
American crop prices in cents US/bushel, soybean meal in $US/short ton, soy oil in cents US/pound
Chicago
Soybeans Aug 2016 990.50 unch 0.00%
Soybeans Sep 2016 973.50 unch 0.00%
Soybeans Nov 2016 956.75 +1.25 +0.13%
Soybeans Jan 2017 957.00 +1.50 +0.16%
Soybeans Mar 2017 950.25 +2.50 +0.26%
Soybeans May 2017 949.50 +2.25 +0.24%
Soybean Meal Aug 2016 329.70 -0.80 -0.24%
Soybean Meal Sep 2016 328.00 -1.50 -0.46%
Soybean Meal Oct 2016 326.10 -1.80 -0.55%
Soybean Oil Aug 2016 30.54 +0.24 +0.79%
Soybean Oil Sep 2016 30.64 +0.22 +0.72%
Soybean Oil Oct 2016 30.76 +0.22 +0.72%
Corn Sep 2016 320.75 -4.25 -1.31%
Corn Dec 2016 331.00 -4.00 -1.19%
Corn Mar 2017 341.50 -3.50 -1.01%
Corn May 2017 348.25 -3.50 -1.00%
Corn Jul 2017 355.00 -3.00 -0.84%
Oats Sep 2016 185.00 -11.25 -5.73%
Oats Dec 2016 185.75 -3.25 -1.72%
Oats Mar 2017 195.75 -2.75 -1.39%
Oats May 2017 201.75 -4.25 -2.06%
Oats Jul 2017 207.50 -4.25 -2.01%
Wheat Sep 2016 403.25 -7.00 -1.71%
Wheat Dec 2016 430.50 -5.75 -1.32%
Wheat May 2017 470.50 -5.25 -1.10%
Wheat Jul 2017 477.50 -5.00 -1.04%
Minneapolis
Spring Wheat Sep 2016 488.75 -3.75 -0.76%
Spring Wheat Dec 2016 501.00 -4.75 -0.94%
Spring Wheat Mar 2017 514.75 -5.00 -0.96%
Spring Wheat May 2017 523.50 -5.25 -0.99%
Spring Wheat Jul 2017 532.50 -5.25 -0.98%
Kansas City
Hard Red Wheat Sep 2016 405.75 -6.50 -1.58%
Hard Red Wheat Dec 2016 432.00 -6.50 -1.48%
Hard Red Wheat Mar 2017 449.00 -6.25 -1.37%
Hard Red Wheat May 2017 459.75 -6.00 -1.29%
Hard Red Wheat Jul 2017 469.25 -6.25 -1.31%
Chicago livestock futures in US¢/pound. (Rounded to two decimal places)
Live Cattle (P) Aug 2016 116.32 -0.43 -0.37%
Live Cattle (P) Oct 2016 114.78 -0.42 -0.36%
Live Cattle (P) Dec 2016 114.88 -0.59 -0.51%
Feeder Cattle (P) Aug 2016 147.57 +0.09 +0.06%
Feeder Cattle (P) Sep 2016 145.22 -0.38 -0.26%
Feeder Cattle (P) Oct 2016 142.98 -0.72 -0.50%
Lean Hogs (P) Aug 2016 67.70 -0.65 -0.95%
Lean Hogs (P) Oct 2016 58.50 -1.00 -1.68%
Lean Hogs (P) Dec 2016 54.38 -0.99 -1.79%


