
Canola futures halted their three day skid, rising on commercial buying and a weak Canadian dollar.
Stock markets calmed down after Monday’s steep slide caused by jitters over China’s weakening economy.
Support for canola also came from stronger soybeans, which saw a short-covering bounce.
But gains were kept in check by improving soil moisture in central Brazil, falling crude and vegetable oil prices and continuing worries about the Chinese economy.
Most traded March canola closed at $484.30, up $2.40 or 0.5 percent.
Read Also
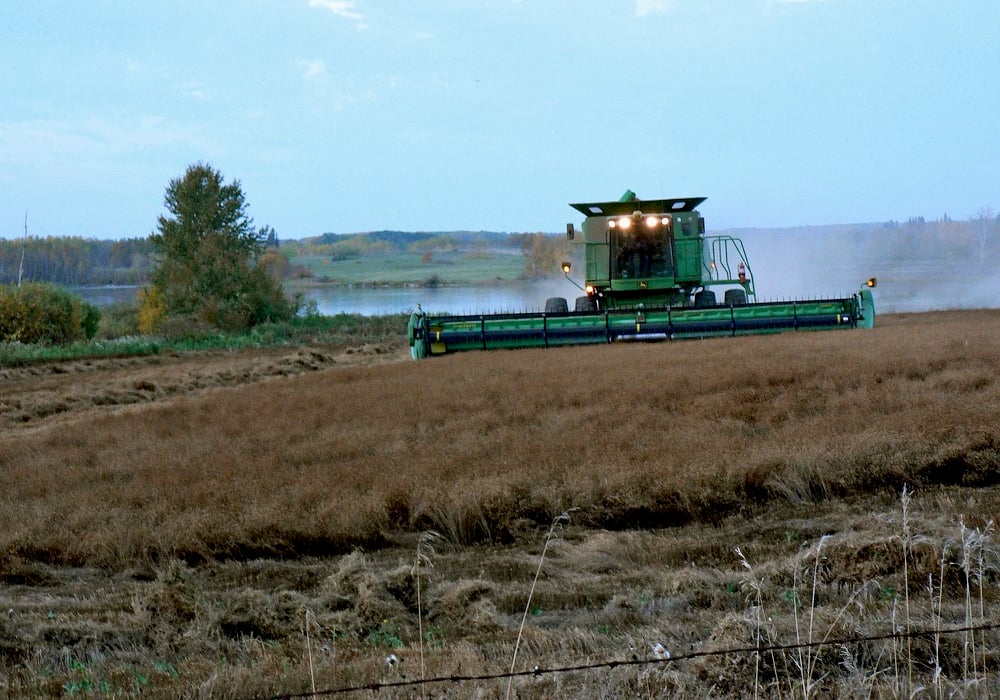
Most of Manitoba harvest wraps up for 2025
Manitoba Agriculture issued its final crop report of 2025, showing the overall provincewide harvest at 97 per cent complete as of Oct. 20. Nearly all major crops have finished combining, with 37 per cent of Manitoba’s sunflowers finished, plus 71 per cent of grain corn and small amounts of soybeans and potatoes left to do.
- Canada’s canola crush continues robust.
The Canadian Oilseed Processors Association said members crushed 165,243 tonnes in the week ending Dec. 30, up 7.6 percent from the week before. Capacity use was at a strong 83 percent.
So far this crop year the crush has topped 3.3 million tonnes, up 12 percent over last year.
- Soybeans got support from a report showing that speculators already have such a negative position there is little chance of further declines and a good chance for a short covering rally.
The U.S. Commodity Futures Trading Commission weekly stats show that the net short in Chicago soybeans and options was at a six month high, leaving speculators over exposed and at risk if the market turns against them.
- Corn and wheat also edged higher on American exchanges on a technical bounce after declining on Monday.
In wheat, the biggest gains were in hard red winter, which climbed about one percent.
- The monthly USDA reports on winter wheat condition came out Monday.
Ratings improved for Kansas and Oklahoma.
In Kansas winter wheat condition rated one percent very poor, seven percent poor, 38 percent fair, 46 percent good and eight percent excellent.
Condition ratings for soft winter wheat in Illinois declined during December after heavy rains flooded part of the state.
- A private consultant thinks Ukraine will export 14 million tonnes of wheat this crop year, up one million tonnes from its last forecast.
That compares to 10.8 million tonnes in 2014-15.
- Analysts expect Malaysian palm oil output dropped in December reflecting the usual seasonal decline and the effects of dry weather from the El Nino.
The monthly palm production report for December comes out Jan. 11.
- Light crude oil nearby futures in New York were down 79 cents to US$35.97 per barrel.
- The Canadian dollar at noon was US71.46 cents, up from 71.59 cents the previous trading day. The U.S. dollar at noon was C$1.3993.
- The Dow Jones industrial average rose 10.07 points, or 0.06 percent, to 17,159.01, the S&P 500 gained 4.11 points, or 0.2 percent, to 2,016.77 and the Nasdaq Composite dropped 11.66 points, or 0.24 percent, to 4,891.43.
Winnipeg ICE Futures Canada dollars per tonne
Canola Jan 2016 476.20 +2.40 +0.51%
Canola Mar 2016 484.30 +2.40 +0.50%
Canola May 2016 491.00 +3.80 +0.78%
Canola Jul 2016 493.50 +3.60 +0.73%
Canola Nov 2016 489.30 +2.80 +0.58%
Milling Wheat Mar 2016 230.00 unch 0.00%
Milling Wheat May 2016 234.00 unch 0.00%
Milling Wheat Jul 2016 239.00 unch 0.00%
Durum Wheat Mar 2016 316.00 unch 0.00%
Durum Wheat May 2016 324.00 unch 0.00%
Durum Wheat Jul 2016 324.00 unch 0.00%
Barley Mar 2016 182.00 -2.00 -1.09%
Barley May 2016 188.00 -2.00 -1.05%
Barley Jul 2016 190.00 -2.00 -1.04%
American crop prices in cents US/bushel, soybean meal in $US/short ton, soy oil in cents US/pound
Chicago
Soybeans Jan 2016 867.75 +3.25 +0.38%
Soybeans Mar 2016 857.25 +1.25 +0.15%
Soybeans May 2016 861.75 +1 +0.12%
Soybeans Jul 2016 869.25 +1.5 +0.17%
Soybeans Aug 2016 871.75 +1.25 +0.14%
Soybeans Sep 2016 871.75 +1.75 +0.20%
Soybean Meal Jan 2016 265.3 +2.1 +0.80%
Soybean Meal Mar 2016 266.3 +1.9 +0.72%
Soybean Meal May 2016 269.1 +1.6 +0.60%
Soybean Oil Jan 2016 29.63 -0.3 -1.00%
Soybean Oil Mar 2016 29.81 -0.31 -1.03%
Soybean Oil May 2016 30.03 -0.31 -1.02%
Corn Mar 2016 353 +1.5 +0.43%
Corn May 2016 358.5 +1 +0.28%
Corn Jul 2016 364.75 +1 +0.27%
Corn Sep 2016 370 +1 +0.27%
Corn Dec 2016 377.75 +0.75 +0.20%
Oats Mar 2016 210.25 -0.25 -0.12%
Oats May 2016 210.5 -1 -0.47%
Oats Jul 2016 213.25 -3 -1.39%
Oats Sep 2016 218.75 -3 -1.35%
Oats Dec 2016 216.25 -1.75 -0.80%
Wheat Mar 2016 461.25 +3 +0.65%
Wheat May 2016 466.75 +2.25 +0.48%
Wheat Jul 2016 474.25 +2 +0.42%
Wheat Sep 2016 484 +2 +0.41%
Wheat Dec 2016 498.25 +1.75 +0.35%
Minneapolis
Spring Wheat Mar 2016 487.75 +3 +0.62%
Spring Wheat May 2016 496 +1.75 +0.35%
Spring Wheat Jul 2016 506.25 +1.5 +0.30%
Spring Wheat Sep 2016 518.75 +1 +0.19%
Spring Wheat Dec 2016 535 +0.75 +0.14%
Kansas
Hard Red Wheat Mar 2016 460 +5.75 +1.27%
Hard Red Wheat May 2016 469.25 +4.75 +1.02%
Hard Red Wheat Jul 2016 479 +4 +0.84%
Hard Red Wheat Sep 2016 493.25 +3.5 +0.71%
Hard Red Wheat Dec 2016 514.25 +2.75 +0.54%


