New crop canola futures continued their gradual rally Tuesday but wheat fell as the trade focused on weather and seeding progress.
November canola has risen for 16 of the past 18 trading days. Today, the gain for November was only 70 cents a tonne to $507.90. There is technical resistance just below $510.
The 14-day relative strength index is 69.10 percent so the contract is getting close to oversold territory.
Old crop July gained $2.10 to $527.60.
Soybeans edged higher, adjusting ahead of the USDA monthly supply and demand report due Wednesday.
The heavy rain in the U.S. affected seeding progress.
Read Also
Confusion cleared on Canadian calf import changes
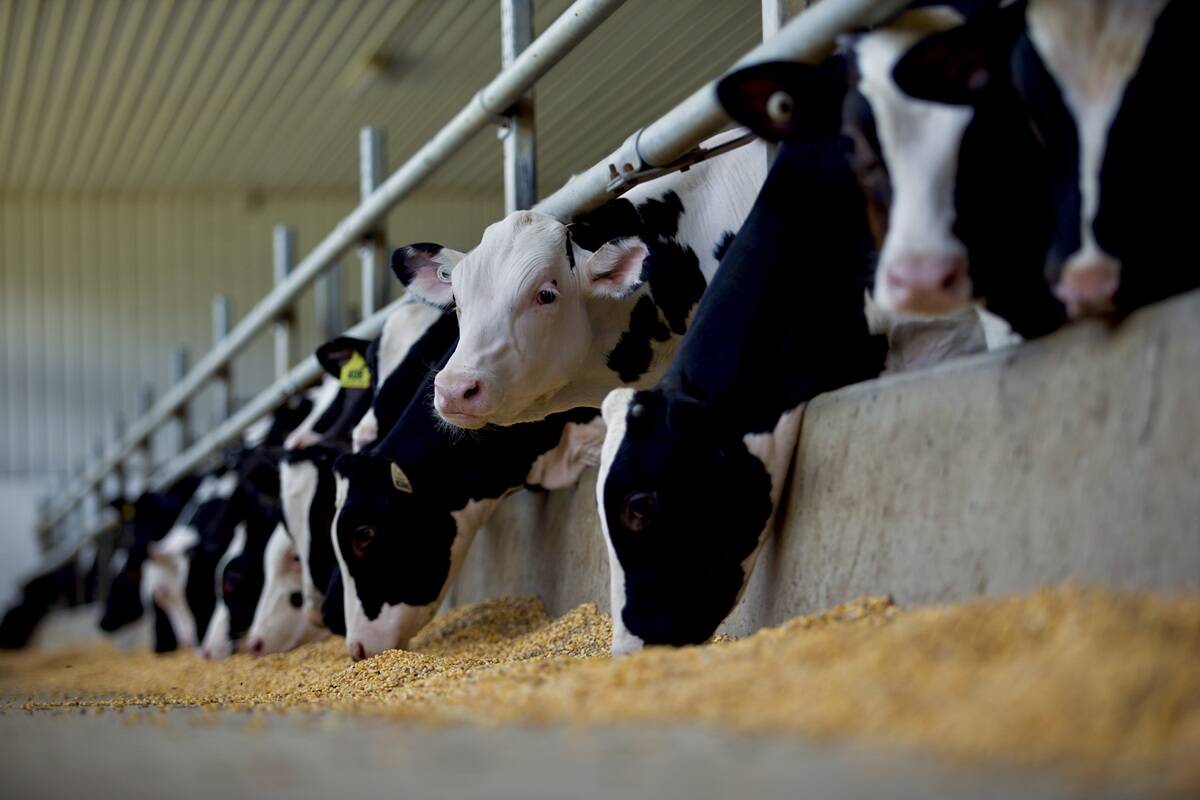
A Canadian Food Inspection Agency (CFIA) announcement on import regulations for feeder calves caused some confusion on the administrative side of Canada’s cattle industry earlier this month
It said the U.S. corn crop was 47 percent planted, behind the five-year average of 52 percent but ahead of an average of analyst expectations for 44 percent.
There is some talk that corn fields flooded by the recent heavy rains in the southern Midwest might be reseeded with shorter season soybeans.
Wheat fell after the USDA rated 53 percent of the U.S. winter wheat crop as good to excellent, down from 54 percent the previous week but above an average of trade expectations for 51 percent.
The government also reported that the U.S. spring wheat crop was 54 percent planted, behind the five-year average of 60 percent but well above the average trade expectation of 45 percent.
The surprising strong pace of spring wheat seeding and the relative strength of the U.S. dollar against a basket of other world currencies pressured wheat futures lower.
MANITOBA CROP
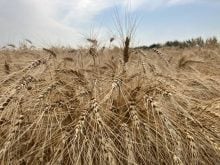
This week’s Manitoba crop report said seeding progress was about at 20 to 25 percent to May 8, with much of it centred in the south central region. Last year at the same time, about 48 percent was seeded.
WEATHER
Judging by rain accumulation forecast maps from the U.S. weather service, a system will start to bring moisture to Alberta on Friday. On Saturday-Sunday the forecast is for accumulations of an inch or more in the northern and central Alberta grain belt, with lesser amounts in the south and in western Saskatchewan.
Saskatchewan and Alberta could be in for more light rain Monday-Tuesday next week, with accumulations of about a half-inch along the Saskatchewan-U.S. border.
Most of the Midwest and the U.S. southern plains are also expected to get accumulations of an inch or more over the next seven days.
USDA REPORT PREVIEW
USDA’s supply and demand report comes out Wednesday morning.
A Reuters poll of analysts showed, on average, they expect 2016-17 U.S. year-end stocks of soybeans to come in a 438 million bushels. Corn stocks are expected to be 2.326 billion bu. and wheat stocks 1.162 billion.
Global stocks for 2016-17 are expected to be 86.59 million tonnes for soybeans, 209.72 million tonnes for corn and 246.15 million for wheat.
OUTSIDE MARKETS
In the afternoon the Canadian dollar was trading around US72.87 cents, up a little from 72.977 cents on Monday. One U.S. dollar equals C$1.372.
Light crude oil nearby futures in New York fell 55 cents to US$45.88 per barrel.
Shortly before the close, the TSX composite was down about a half percent.
The Dow and S&P 500 were a little lower and the Nasdaq was a little higher
Winnipeg ICE Futures Canada dollars per tonne
Canola May 17 527.80 +2.10 +0.40%
Canola Jul 17 527.60 +2.10 +0.40%
Canola Nov 17 507.90 +0.70 +0.14%
Canola Jan 18 512.80 +0.70 +0.14%
Canola Mar 18 517.50 +0.80 +0.15%
Milling Wheat May 17 236.00 -1.00 -0.42%
Milling Wheat Jul 17 237.00 -2.00 -0.84%
Milling Wheat Oct 17 239.00 unch unch
Durum Wheat May 17 273.00 unch unch
Durum Wheat Jul 17 273.00 unch unch
Durum Wheat Oct 17 267.00 +1.00 +0.38%
Barley May 17 137.00 unch unch
Barley Jul 17 138.00 unch unch
Barley Oct 17 140.00 unch unch
American crop prices in cents US/bushel, soybean meal in $US/short ton, soy oil in cents US/pound
Chicago
Soybeans May 2017 965.25 +9.00 +0.94%
Soybeans Jul 2017 974.00 +9.25 +0.96%
Soybeans Aug 2017 974.75 +9.00 +0.93%
Soybeans Sep 2017 970.25 +8.00 +0.83%
Soybeans Nov 2017 967.50 +6.25 +0.65%
Soybeans Jan 2018 974.50 +6.25 +0.65%
Soybean Meal May 2017 314.20 +4.70 +1.52%
Soybean Meal Jul 2017 318.50 +4.90 +1.56%
Soybean Meal Aug 2017 318.90 +4.60 +1.46%
Soybean Oil May 2017 32.65 -0.08 -0.24%
Soybean Oil Jul 2017 32.89 -0.05 -0.15%
Corn May 2017 358.25 +1.50 +0.42%
Corn Jul 2017 366.50 +0.50 +0.14%
Corn Sep 2017 374.50 +0.50 +0.13%
Corn Dec 2017 385.00 +0.75 +0.20%
Corn Mar 2018 394.50 +0.75 +0.19%
Oats May 2017 250.00 -2.75 -1.09%
Oats Jul 2017 245.75 -2.75 -1.11%
Oats Sep 2017 228.00 -2.50 -1.08%
Oats Dec 2017 223.25 -0.75 -0.33%
Oats Mar 2018 226.75 -0.75 -0.33%
Wheat May 2017 421.75 +3.75 +0.90%
Wheat Jul 2017 429.50 -4.00 -0.92%
Wheat Sep 2017 444.50 -4.25 -0.95%
Wheat Dec 2017 464.50 -4.75 -1.01%
Wheat Mar 2018 482.25 -4.75 -0.98%
Minneapolis
Spring Wheat May 2017 528.50 -4.25 -0.80%
Spring Wheat Jul 2017 541.00 -3.75 -0.69%
Spring Wheat Sep 2017 548.50 -3.75 -0.68%
Spring Wheat Dec 2017 557.25 -3.25 -0.58%
Spring Wheat Mar 2018 566.50 -2.00 -0.35%
Kansas City
Hard Red Wheat May 2017 427.00 -5.50 -1.27%
Hard Red Wheat Jul 2017 438.75 -5.50 -1.24%
Hard Red Wheat Dec 2017 480.25 -5.75 -1.18%
Hard Red Wheat Mar 2018 494.75 -5.50 -1.10%
Chicago livestock futures in US¢/pound (rounded to two decimal places)
Live Cattle (P) Jun 2017 124.98 -2.80 -2.19%
Live Cattle (P) Aug 2017 120.65 -2.60 -2.11%
Live Cattle (P) Oct 2017 116.38 -2.70 -2.27%
Feeder Cattle (P) May 2017 144.52 -3.78 -2.55%
Feeder Cattle (P) Aug 2017 152.15 -4.50 -2.87%
Feeder Cattle (P) Sep 2017 151.45 -4.50 -2.89%
Lean Hogs (P) May 2017 70.30 +0.40 +0.57%
Lean Hogs (P) Jun 2017 77.38 unch 0.00%
Lean Hogs (P) Jul 2017 77.50 +0.28 +0.36%


