Canola futures closed slightly lower Monday as did corn and wheat, while soybeans gained a fraction.
Canola was slightly higher through most of the morning on ideas that last week’s fall was overdone, but it drifted lower into the close.
There was some concern that cool weather this week and forecasts for more rain in the Prairies could slow the start of harvest. However, some canola is being swathed and the prospect of harvest supplies soon being available to the market is a negative factor for prices.
Read Also
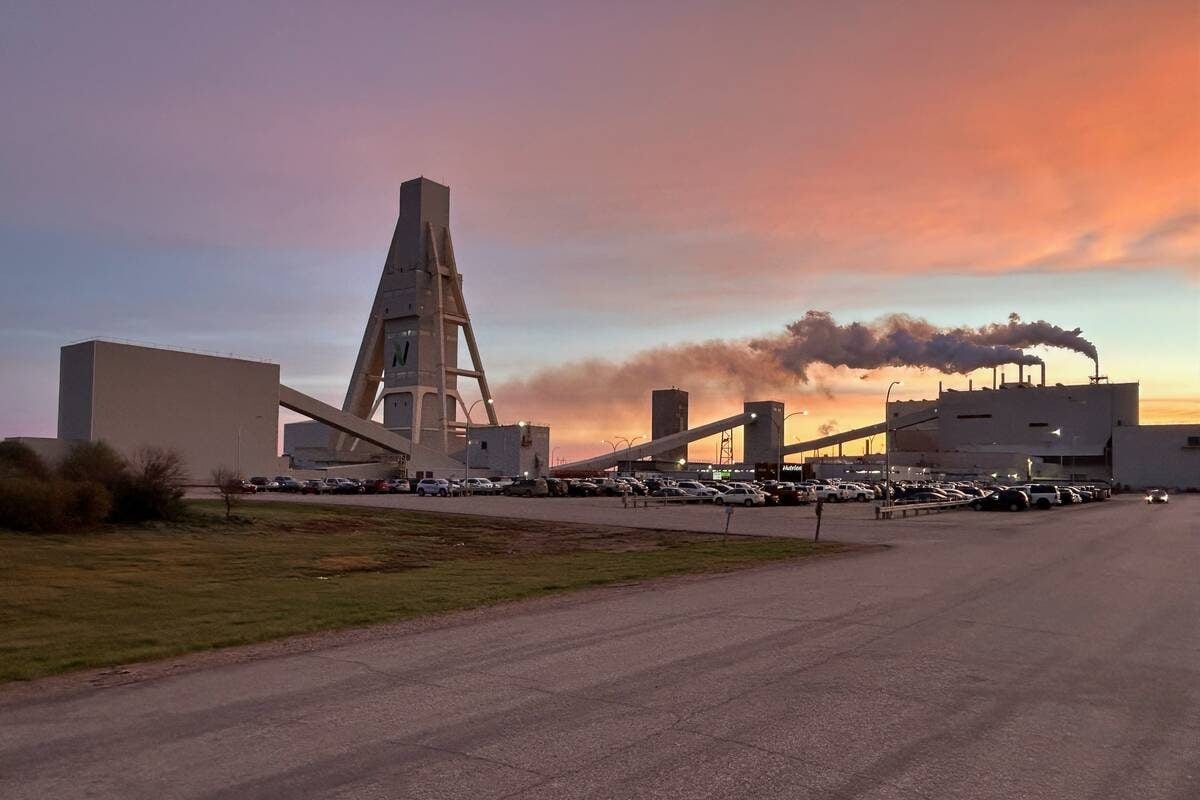
Nutrien tops profit estimates, launches review of phosphate business
Nutrien beat analysts’ expectations for third-quarter profit on Wednesday, and said it would initiate a review of strategic alternatives for its phosphate business.
Environment Canada said the temperature fell to 1C early this morning at Edmonton airport. It hit 3C at Red Deer, Alta.
Statistics Canada issues its first assessment of the size of Canada’s crops. However, the surveys were done in late July and early August just as the weather shifted to a wetter trend after the dry early summer in the western Prairies.
U.S. soybean futures were slightly higher as early support from government data on unplanted acres was largely offset by downward pressure from a rainy Midwest forecast that should bolster the crop at a key stage of development.
Corn closed weak, anchored by favorable crop weather, while wheat shed more than one percent on ample global supplies and a firm U.S. dollar that further dampened U.S. export prospects.
Corn and soybean markets were range-bound as traders awaited updated reports on developing crops from an annual crop tour of the Midwest this week. Many were seeking evidence that would confirm or refute last week’s higher-than-expected U.S. Department of Agriculture production forecasts.
“A lot of people are questioning whether USDA was correct in their assessment about the crops, and time will tell,” said Jim Gerlach, president of A/C Trading in Fowler, Indiana.
“Most people think the crop is going to be worse than what USDA said in the east, and maybe at, or better than, what they were saying in the west,” he said.
Crop scouts on day one of the Pro Farmer Midwest crop tour found variable yield potential in Ohio and strong prospects in South Dakota.
The tour enters the heart of the Midwest farm belt later in the week and concludes on Thursday. Pro Farmer will release its U.S. production forecasts on Friday.
The weekly crop condition report issued after the market closed said the corn good-to-excellent rating fell one percentage point. Soybeans were unchanged.
The U.S. spring wheat crop is 56 percent harvested, ahead of the five year average of 31 percent.
The USDA’s Farm Services Agency reported “prevented plantings” acreage above trade expectations.
Soybeans drew some support from a monthly National Oilseed Processors Association report showing a record crush in July.
Wheat fell.
“We have a lot of wheat around. It keeps trying to put in a bottom, but does not have the fundamentals to support that,” said Arlan Suderman, senior market analyst at Illinois-based Water Street Advisory.
Light crude oil nearby futures in New York were down 63 cents to US$41.87 per barrel.
The Canadian dollar at noon was US76.39 cents, down from 76.46 cents the previous trading day. The U.S. dollar at noon was C$1.3091.
Winnipeg ICE Futures Canada dollars per tonne
Canola Nov 2015 485.50 -1.00 -0.21%
Canola Jan 2016 484.60 -0.60 -0.12%
Canola Mar 2016 483.30 -0.80 -0.17%
Canola May 2016 479.80 -1.10 -0.23%
Canola Jul 2016 475.20 -1.20 -0.25%
Milling Wheat Oct 2015 228.00 -5.00
Milling Wheat Dec 2015 228.00 -5.00
Milling Wheat Mar 2016 232.00 -5.00
Durum Wheat Oct 2015 355.00 unch
Durum Wheat Dec 2015 360.00 unch
Durum Wheat Mar 2016 365.00 unch
Barley Oct 2015 205.10 unch
Barley Dec 2015 205.10 unch
Barley Mar 2016 207.10 unch
American crop prices in cents US/bushel, soybean meal in $US/short ton, soy oil in cents US/pound
Chicago
Soybeans Sep 2015 927 +1.75 +0.19%
Soybeans Nov 2015 917 +0.5 +0.05%
Soybeans Jan 2016 922.25 +0.25 +0.03%
Soybeans Mar 2016 922 +0.75 +0.08%
Soybeans May 2016 921 +0.5 +0.05%
Soybeans Jul 2016 924.5 +0.5 +0.05%
Soybean Meal Sep 2015 325.4 +0.2 +0.06%
Soybean Meal Oct 2015 317.7 +0.7 +0.22%
Soybean Meal Dec 2015 314.7 +0.5 +0.16%
Soybean Oil Sep 2015 29.06 -0.02 -0.07%
Soybean Oil Oct 2015 29.17 -0.02 -0.07%
Soybean Oil Dec 2015 29.37 -0.03 -0.10%
Corn Sep 2015 363.25 -0.75 -0.21%
Corn Dec 2015 374.5 -1 -0.27%
Corn Mar 2016 386 -1 -0.26%
Corn May 2016 392.25 -1.75 -0.44%
Corn Jul 2016 397 -2 -0.50%
Oats Sep 2015 223.25 -4.25 -1.87%
Oats Dec 2015 236 -3.5 -1.46%
Oats Mar 2016 243.75 -4.25 -1.71%
Oats May 2016 251.25 -4 -1.57%
Oats Jul 2016 252.25 -4 -1.56%
Wheat Sep 2015 500.5 -6 -1.18%
Wheat Dec 2015 504.5 -7.25 -1.42%
Wheat Mar 2016 509.75 -7 -1.35%
Wheat May 2016 513.25 -7.25 -1.39%
Wheat Jul 2016 516.25 -7.25 -1.38%
Minneapolis
Spring Wheat Sep 2015 513 -5.5 -1.06%
Spring Wheat Dec 2015 528.5 -5.25 -0.98%
Spring Wheat Mar 2016 544.25 -5 -0.91%
Spring Wheat May 2016 554 -5 -0.89%
Spring Wheat Jul 2016 563.75 -3.75 -0.66%
Kansas City
Hard Red Wheat Sep 2015 482.25 -7.5 -1.53%
Hard Red Wheat Dec 2015 502.25 -7.75 -1.52%
Hard Red Wheat Mar 2016 516.25 -7.75 -1.48%
Hard Red Wheat May 2016 526.25 -7.75 -1.45%
Hard Red Wheat Jul 2016 535.5 -8 -1.47%