When the biggest buyer of beans has indigestion, canola gets a gut ache.
That’s the state of the crop futures markets today, with canola following soybeans and soy oil lower on fears that China’s demand will be sapped by worries of even more slowing.
“It’s all about China,” said Errol Anderson of Pro Market in Calgary a few minutes after the crop futures markets closed.
Most cereal grains held quite firm and some wheat contracts rose, but soybeans, its components and related crops fell, with traders wondering how much more bad China news is coming.
Read Also

Canada and China discuss disputes over canola and EVs, says Ottawa
Senior Canadian and Chinese officials discussed bilateral trade disputes involving canola and electric vehicles on Friday, Ottawa said, but gave no indication of any immediate breakthrough.
The country reported slowing factory production overnight.
Canola fell less than soybeans.
“Traders couldn’t care less about the crop readings,” said Anderson.
“It really doesn’t matter.”
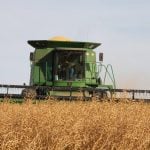
U.S. crop ratings show soybeans at about average development, corn is a little behind usual and spring wheat far ahead of usual in terms of harvesting, with almost 90 percent completed.
U.S. soybeans are in better shape than some analysts had expected, the U.S. Department of Agriculture reported Monday, adding to the downward pressure on veg oil crops. However, the real story was China and its weakening economy.
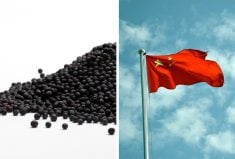
The reason China has such a big impact on soybean prices is that it has been the main driving force behind world soybean demand for more than a decade. China’s voracious attitude for soybeans has allowed Brazil’s massive increase in production to occur without depressing prices.
However, Chinese factory activity dropped by the most in three years during August, its government reported, suggesting that the country’s slowing demand might be slowing more than already anticipated.
European vegetable oil prices fell, also hit by the sense that China is weakening as a source of demand.
Stock markets were off Tuesday because of the China worries.
Oil fell sharply, wiping out the optimism among some that a bounce off the bottom had occurred yesterday.
Most Brent crude futures are back to about $50, and West Texas Intermediate to $45.
Light crude oil nearby futures in New York were down $3.79 to US$45.41 per barrel.
The Canadian dollar at noon was US75.88 cents, up from 75.63 cents the previous trading day. The U.S. dollar at noon was C$1.3179.
Winnipeg ICE Futures Canada dollars per tonne
Canola Nov 2015 467.10 -7.70 -1.62%
Canola Jan 2016 472.70 -7.10 -1.48%
Canola Mar 2016 477.10 -7.20 -1.49%
Canola May 2016 477.50 -7.10 -1.47%
Canola Jul 2016 477.70 -7.10 -1.46%
Milling Wheat Oct 2015 225.00 -1.00 -0.44%
Milling Wheat Dec 2015 225.00 -1.00 -0.44%
Milling Wheat Mar 2016 229.00 -1.00 -0.43%
Durum Wheat Oct 2015 335.00 unch 0.00%
Durum Wheat Dec 2015 335.00 unch 0.00%
Durum Wheat Mar 2016 340.00 unch 0.00%
Barley Oct 2015 184.00 -7.90 -4.12%
Barley Dec 2015 184.00 -7.90 -4.12%
Barley Mar 2016 186.00 -7.90 -4.07%
American crop prices in cents US/bushel, soybean meal in $US/short ton, soy oil in cents US/pound
Chicago
Soybeans Sep 2015 884.75 -12.75 -1.42%
Soybeans Nov 2015 874 -13.5 -1.52%
Soybeans Jan 2016 878.75 -13.5 -1.51%
Soybeans Mar 2016 881 -12.75 -1.43%
Soybeans May 2016 884 -12.5 -1.39%
Soybeans Jul 2016 887.5 -12.75 -1.42%
Soybean Meal Sep 2015 317.9 -3 -0.93%
Soybean Meal Oct 2015 310.5 -3.1 -0.99%
Soybean Meal Dec 2015 308.1 -3.2 -1.03%
Soybean Oil Sep 2015 27.22 -0.7 -2.51%
Soybean Oil Oct 2015 27.34 -0.69 -2.46%
Soybean Oil Dec 2015 27.55 -0.7 -2.48%
Corn Sep 2015 356 -7.75 -2.13%
Corn Dec 2015 369 -6.25 -1.67%
Corn Mar 2016 380.25 -6 -1.55%
Corn May 2016 387 -5.75 -1.46%
Corn Jul 2016 391.5 -5.75 -1.45%
Oats Sep 2015 224 -11.5 -4.88%
Oats Dec 2015 224 -6.25 -2.71%
Oats Mar 2016 225 -4.75 -2.07%
Oats May 2016 230.5 -4.75 -2.02%
Oats Jul 2016 231.5 -4.75 -2.01%
Wheat Sep 2015 484 +1.5 +0.31%
Wheat Dec 2015 486.25 +1.25 +0.26%
Wheat Mar 2016 491 +0.75 +0.15%
Wheat May 2016 495 +0.75 +0.15%
Wheat Jul 2016 498 unch 0.00%
Minneapolis
Spring Wheat Sep 2015 492 -4.5 -0.91%
Spring Wheat Dec 2015 511.25 -3.25 -0.63%
Spring Wheat Mar 2016 526.75 -3.5 -0.66%
Spring Wheat May 2016 536.75 -4 -0.74%
Spring Wheat Jul 2016 548 -3.25 -0.59%
Kansas City
Hard Red Wheat Dec 2015 482.25 -5.5 -1.13%
Hard Red Wheat Mar 2016 495.75 -6 -1.20%
Hard Red Wheat May 2016 505.5 -6 -1.17%
Hard Red Wheat Jul 2016 514.5 -6.25 -1.20%