Canola futures barely budged on Wednesday while American crop futures edged higher.
Bargain buying was a feature in the Chicago markets. In Canada, the loonie crept higher and that held canola back.
Traders are starting to roll May positions into July.
The ICE Futures Canada best basis bid benchmarket widened to -$5 under the May contract. It had been at zero for several days.
WATCH THIS WEEK’S VIDEO CROP MARKET ANALYSIS
Read Also
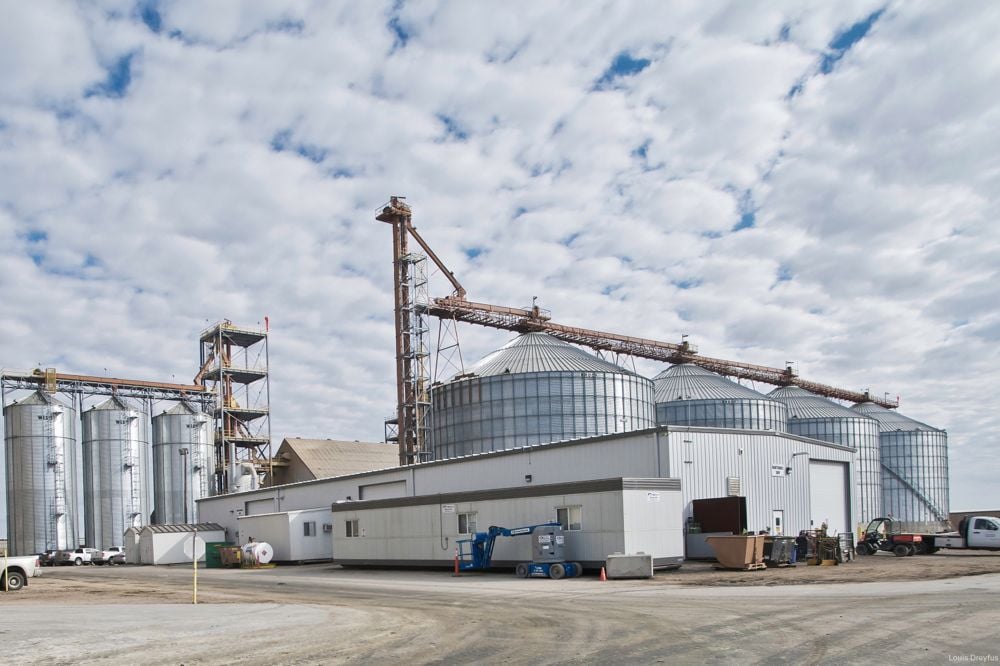
Louis Dreyfus posts higher volumes, lower profits in first half
Agricultural commodity merchant Louis Dreyfus Company recorded a rise in first-half sales, supported by higher volumes shipped, but weaker prices for most crops pushed down profits, it said on Friday.
The Bank of Canada keep its benchmark interest rate unchanged today, but it painted a somewhat rosier view of the Canadian economy.
If true, it could lead to an interest rate increase late this year or early next year.
WEATHER
Prairie farmers are preparing for a cool, damp weekend, with rain and snow accumulations mainly limited to the northern grain belt although almost all areas could get some moisture.
The seven-day forecast also has rain in the U.S. Midwest, meaning early progress on seeding will be limited.
PORT ACTIVITY
As of week 36 of the crop year, to April 11, there are 27 ships in the line up at Vancouver, up one from the previous week. At Prince Rupert there are three, same as the previous week, according to the weekly report from Quorum Corp..
OUTSIDE MARKETS
Light crude oil nearby futures in New York were down 29 cents to US$53.11 per barrel.
In the afternoon, the Canadian dollar was trading around US75.38 cents, up from 74.99 cents the previous trading day. The U.S. dollar was C$1.3266.
Rising tensions with Russia, Syria and North Korea kept investors on edge. President Trump in an interview with the Wall Street Journal complained that the U.S. dollar was too high, but also said he wants to keep interest rates low.
The Toronto Stock Exchange composite fell 78.71 points or 0.5 percent to 15,648.40.
The Dow Jones Industrial Average closed down 59.44 points, or 0.29 percent, to 20,591.86, the S&P 500 lost 8.85 points, or 0.38 percent, to 2,344.93 and the Nasdaq Composite dropped 30.61 points, or 0.52 percent, to 5,836.16.
Winnipeg ICE Futures Canada dollars per tonne
Canola May 2017 495.00 +0.50 +0.10%
Canola Jul 2017 494.00 -0.80 -0.16%
Canola Nov 2017 479.40 +0.20 +0.04%
Canola Jan 2018 482.40 +0.80 +0.17%
Canola Mar 2018 485.70 +1.80 +0.37%
Milling Wheat May 2017 227.00 +1.00 +0.44%
Milling Wheat Jul 2017 228.00 +1.00 +0.44%
Milling Wheat Oct 2017 224.00 +1.00 +0.45%
Durum Wheat May 2017 272.00 unch 0.00%
Durum Wheat Jul 2017 271.00 unch 0.00%
Durum Wheat Oct 2017 263.00 unch 0.00%
Barley May 2017 137.00 unch 0.00%
Barley Jul 2017 138.00 unch 0.00%
Barley Oct 2017 140.00 unch 0.00%
American crop prices in cents US/bushel, soybean meal in $US/short ton, soy oil in cents US/pound
Chicago
Soybeans May 2017 947.75 +8.50 +0.90%
Soybeans Jul 2017 958.75 +8.00 +0.84%
Soybeans Aug 2017 960.75 +8.00 +0.84%
Soybeans Sep 2017 957.50 +7.50 +0.79%
Soybeans Nov 2017 955.50 +7.00 +0.74%
Soybeans Jan 2018 961.25 +6.50 +0.68%
Soybean Meal May 2017 312.70 +3.40 +1.10%
Soybean Meal Jul 2017 317.00 +3.50 +1.12%
Soybean Meal Aug 2017 317.80 +3.40 +1.08%
Soybean Oil May 2017 31.24 +0.17 +0.55%
Soybean Oil Jul 2017 31.46 +0.15 +0.48%
Soybean Oil Aug 2017 31.57 +0.15 +0.48%
Corn May 2017 369.00 +2.50 +0.68%
Corn Jul 2017 376.00 +2.25 +0.60%
Corn Sep 2017 382.75 +2.00 +0.53%
Corn Dec 2017 392.50 +2.00 +0.51%
Corn Mar 2018 401.00 +1.75 +0.44%
Oats May 2017 224.50 +4.75 +2.16%
Oats Jul 2017 223.75 +4.25 +1.94%
Oats Sep 2017 220.25 +3.00 +1.38%
Oats Dec 2017 220.75 +2.75 +1.26%
Oats Mar 2018 228.00 +1.50 +0.66%
Wheat May 2017 433.25 unch 0.00%
Wheat Jul 2017 446.25 -1.25 -0.28%
Wheat Sep 2017 459.75 -1.25 -0.27%
Wheat Dec 2017 480.25 -0.75 -0.16%
Wheat Mar 2018 496.50 -0.75 -0.15%
Minneapolis
Spring Wheat May 2017 528.75 +1.00 +0.19%
Spring Wheat Jul 2017 537.25 +1.75 +0.33%
Spring Wheat Sep 2017 545.50 +2.00 +0.37%
Spring Wheat Dec 2017 556.50 +1.75 +0.32%
Spring Wheat Mar 2018 567.50 +2.00 +0.35%
Kansas City
Hard Red Wheat May 2017 430.00 +0.25 +0.06%
Hard Red Wheat Jul 2017 442.50 +0.50 +0.11%
Hard Red Wheat Sep 2017 458.50 +0.75 +0.16%
Hard Red Wheat Dec 2017 482.50 +0.50 +0.10%
Hard Red Wheat Mar 2018 499.25 +0.25 +0.05%
Chicago livestock futures in US¢/pound (rounded to two decimal places)
Live Cattle (P) Apr 2017 124.20 +0.95 +0.77%
Live Cattle (P) Jun 2017 114.35 +0.65 +0.57%
Live Cattle (P) Aug 2017 110.38 +0.53 +0.48%
Feeder Cattle (P) Apr 2017 137.50 +0.32 +0.23%
Feeder Cattle (P) May 2017 137.82 +0.50 +0.36%
Feeder Cattle (P) Aug 2017 139.95 +0.77 +0.55%
Lean Hogs (P) Apr 2017 62.22 -0.43 -0.69%
Lean Hogs (P) May 2017 68.02 -1.56 -2.24%
Lean Hogs (P) Jun 2017 72.28 -1.72 -2.32%