U.S. crop markets were mostly up at the close Thursday but canola finished lower on profit taking and a stronger loonie.
Prairie farmers made fast seeding progress in the last week. Saskatchewan’s weekly crop report issued today said 27 percent of the crop was seeded as of May 21, compared to eight percent the previous week. Despite the progress the rate still lags the five-year average for this time of year of about 44 percent.
Sask Ag said 23 percent of canola is in the ground in the province.
Read Also
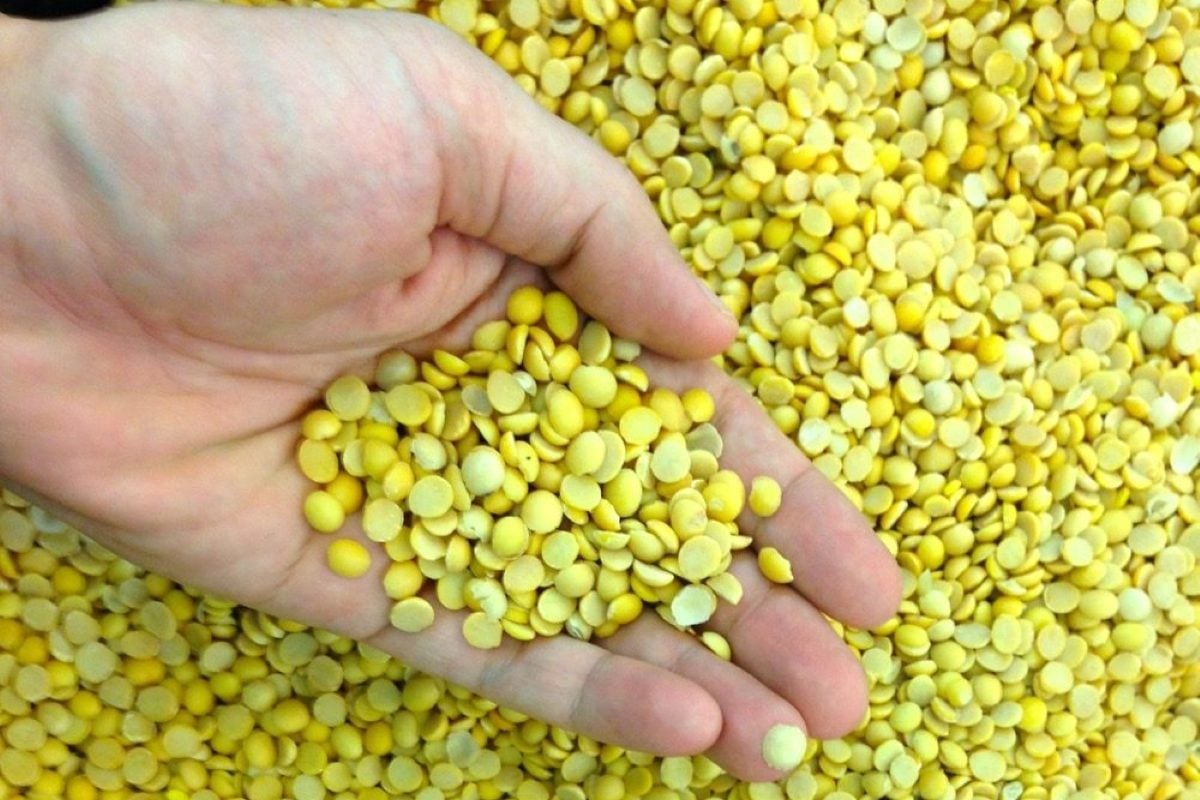
Pulse Weekly: India imposes 30 per cent tariff on yellow peas
Pulse Canada is quite unhappy with the Indian government’s recent move to slap a 30 per cent tariff on its yellow pea imports, said the pulse organization’s board chair Terry Youzwa.
Seeding is most advanced in the southwest and least advanced in the north east.
Manitoba Agriculture’s weekly crop report issued May 21 said seeding is estimated to be 40 percent complete in the southwest, 35 to 40 percent complete in the northwest, 45 percent in the central region, 65 percent in the eastern region and 30 percent in the Interlake.
Rain is falling in southern Alberta today and is expected to continue Friday. It has been exceptionally dry and the rain is welcome to get crops germinating. The outlook for rain on the weekend in Saskatchewan was scaled back in today’s forecasts. Some showers are expected, but accumulations are now lower than they were in Wednesday’s forecast.
U.S. soybeans ended up on tight old crop stocks and a weaker dollar. It was a wild session for old crop prices with the contract trading in a 60 cent range.
Soy oil was little changed. Soybeans, corn and wheat were all supported by stronger than expected weekly exports.
Reuters reported Argentina’s agriculture ministry cut its estimate of the country’s 2012-13 soybean crop to 50.6 million tonnes, from 51.3 million in April.
Reuters reported that China intends to raise its rapeseed stockpile buying by 14 percent to five million tonnes at a price of $830 per tonne in 2013. The high domestic price encourages Chinese crushers to import from Canada and Australia.
Outside markets were torn over interpretations of what U.S. Federal Reserve officials are saying about the future of the central bank’s stimulus measures.
Chairman Ben Bernanke said Wednesday that the $85 billion a month of asset purchases could be reduced “in the next few meetings” if economic conditions improve, such as lower unemployment.
Today James Bullard, president of the Federal Reserve Bank of St. Louis, said he did not think the Fed was “that close” to starting the process of winding down its support although it was the likely next step if the economy continued to improve and inflation picks up, Reuters reported.
He added that if the bank did make a policy change, it would only trim its buying, not end it.
Weak Chinese manufacturing data, which had hammered some Asian markets overnight, also weighed on North American stock markets.
Winnipeg ICE Futures Canada dollars per tonne
Canola Jul 2013 642.40 -4.90 -0.76%
Canola Nov 2013 555.60 -3.80 -0.68%
Canola Jan 2014 556.80 -4.00 -0.71%
Canola Mar 2014 551.80 -4.40 -0.79%
Canola May 2014 544.80 -5.10 -0.93%
Milling Wheat Jul 2013 294.00 unch 0.00%
Milling Wheat Oct 2013 294.00 unch 0.00%
Milling Wheat Dec 2013 294.00 unch 0.00%
Durum Wheat Jul 2013 301.90 unch 0.00%
Durum Wheat Oct 2013 294.90 unch 0.00%
Durum Wheat Dec 2013 299.40 unch 0.00%
Barley Jul 2013 244.00 unch 0.00%
Barley Oct 2013 194.00 unch 0.00%
Barley Dec 2013 199.00 unch 0.00%
American crop prices in cents US/bushel, soybean meal in $US/short ton, soy oil in cents US/pound
Chicago
Soybeans Jul 2013 1499.5 +5.25 +0.35%
Soybeans Aug 2013 1414.5 +18.25 +1.31%
Soybeans Sep 2013 1299.5 +8.75 +0.68%
Soybeans Nov 2013 1243 +4.25 +0.34%
Soybeans Jan 2014 1249.25 +13.25 +1.07%
Soybeans Mar 2014 1252.75 +13 +1.05%
Soybean Meal Jul 2013 437 -3.6 -0.82%
Soybean Meal Aug 2013 410.6 +0.2 +0.05%
Soybean Meal Sep 2013 383.2 +1.9 +0.50%
Soybean Oil Jul 2013 49.66 +0.02 +0.04%
Soybean Oil Aug 2013 49.53 +0.04 +0.08%
Soybean Oil Sep 2013 49.31 +0.05 +0.10%
Corn Jul 2013 662 +3.5 +0.53%
Corn Sep 2013 563.5 +3.75 +0.67%
Corn Dec 2013 534.75 +4.25 +0.80%
Corn Mar 2014 545.5 +4.5 +0.83%
Corn May 2014 553.25 +4.25 +0.77%
Oats Jul 2013 370.25 +3.75 +1.02%
Oats Sep 2013 365 +8.25 +2.31%
Oats Dec 2013 363.5 +8 +2.25%
Oats Mar 2014 368.75 +8 +2.22%
Oats May 2014 371 +8 +2.20%
Wheat Jul 2013 703.25 +14.75 +2.14%
Wheat Sep 2013 709.75 +14 +2.01%
Wheat Dec 2013 723 +12.5 +1.76%
Wheat Mar 2014 737.5 +10.5 +1.44%
Wheat May 2014 744.25 +10.25 +1.40%
Minneapolis
Spring Wheat Jul 2013 813.25 +5.5 +0.68%
Spring Wheat Sep 2013 805 +7.75 +0.97%
Spring Wheat Dec 2013 811.75 +8 +1.00%
Spring Wheat Mar 2014 824.25 +9.5 +1.17%
Spring Wheat May 2014 829.75 +10.75 +1.31%
Kansas City
KCBT Red Wheat Jul 2013 754.5 +11.25 +1.51%
KCBT Red Wheat Sep 2013 761.5 +10.5 +1.40%
KCBT Red Wheat Dec 2013 778.5 +12.25 +1.60%
KCBT Red Wheat Mar 2014 791.5 +12.75 +1.64%
KCBT Red Wheat May 2014 795.75 +12.75 +1.63%
Light crude oil nearby futures in New York down three cents at $94.25 US per barrel.
The Canadian dollar at noon was 96.99 cents US, up from 96.78 cents the previous trading day. The U.S. dollar at noon was $1.0310 Cdn.
In unofficial early tallies —
The Toronto Stock Exchange’s S&P/TSX composite index closed down 94.41 points, or 0.74 percent, at 12,658.09.
The Dow Jones industrial average fell 12.67 points, or 0.08 percent, to 15,294.50 at the close.
The Standard & Poor’s 500 Index slipped 4.84 points, or 0.29 percent, to finish at 1,650.51.
The Nasdaq Composite Index dropped 3.88 points, or 0.11 percent, to close at 3,459.42.