
Rain forecast for the Midwest and an improved production forecast for Ukraine pressured crop markets down on Tuesday.
A big rise in the U.S. dollar also weighed on U.S. crop futures. The weaker loonie did not seem to do much to lessen the fall in canola.
November canola fell $3 to $444.10 ending a four-day rally. Profit taking and generally favourable weather weighed on the oilseed, as did weaker soybeans and soy oil.
Day 2 of the CWB crop tour of the Prairies continued to show a wide variety of crop conditions with generally weaker crops in the eastern Prairies and better conditions in the west. The tour will collate results on Thursday and release an average yield forecast for wheat and canola.
Read Also
Most of Manitoba harvest wraps up for 2025
Manitoba Agriculture issued its final crop report of 2025, showing the overall provincewide harvest at 97 per cent complete as of Oct. 20. Nearly all major crops have finished combining, with 37 per cent of Manitoba’s sunflowers finished, plus 71 per cent of grain corn and small amounts of soybeans and potatoes left to do.
Follow the action on Twitter at #croptour14 and we have stories and updates at Producer.com.
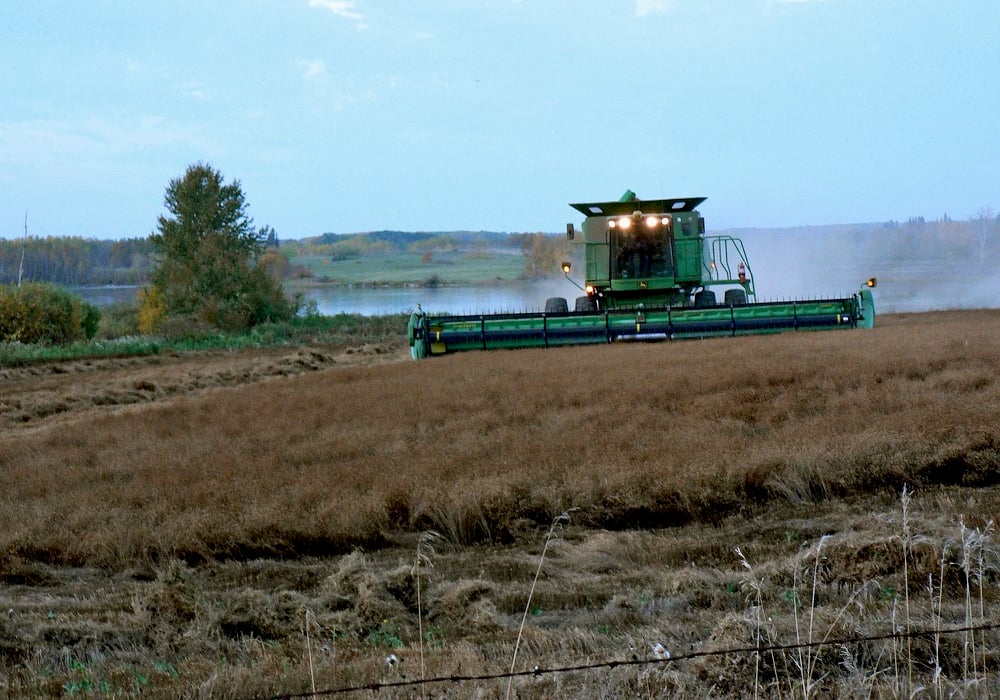
The warm weather is helping to advance crops across the Prairies.
In the U.S., the weekly crop condition reports on corn and soybeans fell one percentage point in the past week. It was the first condition decline in several weeks. There are pockets of dryness showing up in the Midwest.
However, the condition decline did not support crop prices today. Temperatures in the Midwest are not hot and that is minimizing the stress from lack of rain. Also, weather forecasts that call for moisture next week in the dry areas took precedence in traders’ minds.
UkrAgroConsult on Tuesday raised its forecast for Ukraine’s 2014 grain harvest by about four percent to 57.4 million tonnes, mainly due to higher grain yields. That would be about the same production as last year.
The fighting and turmoil in Ukraine and the economic sanctions imposed on Russia appear to have little negative impact on production or exports from the Black Sea region.
That weighed on wheat futures, with Chicago December down about 2.5 percent today. Minneapolis December was down 1.59 percent.
Russia is enduring a heat wave this week that could trim corn yield potential.
Australian exporter CBH Group says the crop in the largest wheat producing state, Western Australia, is doing well. It forecast a wheat crop of 9.4 million tonnes, one million more than the Australian Bureau of Agricultural and Resource Economics and Sciences forecast last month, but still less than last year’s 10.5 million tonnes.
CBH forecast all grain production in the state at 15.4 million tonnes.
That could offset worries about declining conditions in eastern Australian cropping areas where dry weather has been a problem.
The U.S. currency strengthened today as traders positioned ahead of the latest statement from the U.S. Federal Reserve. Some believe that the improving labour market in the U.S. will cause the Fed on Wednesday to hint at a hike in interest rates in 2015.
Also, the U.S. will release its quarterly gross domestic product numbers on Wednesday
A Reuters poll shows on average analysts expected three percent GDP growth, up from 2.9 percent contraction in the first quarter.
Winnipeg ICE Futures Canada dollars per tonne
Canola Nov 2014 444.10 -3.00 -0.67%
Canola Jan 2015 448.30 -2.80 -0.62%
Canola Mar 2015 449.00 -2.70 -0.60%
Canola May 2015 445.30 -2.90 -0.65%
Canola Jul 2015 440.90 -3.20 -0.72%
Milling Wheat Oct 2014 186.00 -4.00 -2.11%
Milling Wheat Dec 2014 192.00 -3.00 -1.54%
Milling Wheat Mar 2015 193.00 -3.00 -1.53%
Durum Wheat Oct 2014 250.00 unch0.00%
Durum Wheat Dec 2014 256.00 unch0.00%
Durum Wheat Mar 2015 257.00 unch0.00%
Barley Oct 2014 137.50 unch0.00%
Barley Dec 2014 139.50 unch0.00%
Barley Mar 2015 140.50 unch0.00%
American crop prices in cents US/bushel, soybean meal in $US/short ton, soy oil in cents US/pound
Chicago
Soybeans Aug 20141226.5 -10 -0.81%
Soybeans Sep 20141121.5 -15.5 -1.36%
Soybeans Nov 20141095 -12.75 -1.15%
Soybeans Jan 2015 1102.25 -12 -1.08%
Soybeans Mar 20151108.25 -11.75 -1.05%
Soybeans May 20151114 -11.25 -1.00%
Soybean Meal Aug 2014 395.4 -7.4 -1.84%
Soybean Meal Sep 2014 369.2 -6 -1.60%
Soybean Meal Oct 2014 357.3 -2.9 -0.81%
Soybean Oil Aug 2014 36.25 -0.27 -0.74%
Soybean Oil Sep 2014 36.34 -0.26 -0.71%
Soybean Oil Oct 2014 36.38 -0.24 -0.66%
Corn Sep 2014361.5 -6.25 -1.70%
Corn Dec 2014371 -5.75 -1.53%
Corn Mar 2015383 -5.5 -1.42%
Corn May 2015391.25 -5.25 -1.32%
Corn Jul 2015 399 -4.5 -1.12%
Oats Sep 2014356.5 -10 -2.73%
Oats Dec 2014333.25 -4.25 -1.26%
Oats Mar 2015318.75 -3.5 -1.09%
Oats May 2015313 -3 -0.95%
Oats Jul 2015 311.5 -2.5 -0.80%
Wheat Sep 2014 520 -14.75 -2.76%
Wheat Dec 2014 543.75 -14 -2.51%
Wheat Mar 2015 568.25 -12 -2.07%
Wheat May 2015 583.5 -11.25 -1.89%
Wheat Jul 2015 594 -12 -1.98%
Minneapolis
Spring Wheat Sep 2014 610.5 -10.75 -1.73%
Spring Wheat Dec 2014 620.75 -10 -1.59%
Spring Wheat Mar 2015 634 -8.75 -1.36%
Spring Wheat May 2015 642.25 -7.75 -1.19%
Spring Wheat Jul 2015 649.5 -7.25 -1.10%
Kansas City
Hard Red Wheat Sep 2014 611.5 -14 -2.24%
Hard Red Wheat Dec 2014 628.25 -12 -1.87%
Hard Red Wheat Mar 2015 635.5 -12 -1.85%
Hard Red Wheat May 2015 639.75 -12.25 -1.88%
Hard Red Wheat Jul 2015632.5 -11.75 -1.82%
Light crude oil nearby futures in New York dropped 70 cents at $100.97 US per barrel.
The Canadian dollar at noon was 92.16 cents US, down from 92.58 cents the previous trading day. The U.S. dollar at noon was $1.0851 Cdn.
In early, unofficial tallies —
The TSX composite edged up by 1.33 points or 0.01 percent to 15,446.55
The Dow Jones industrial average fell 69.9 points, or 0.41 percent, to 16,912.69.
The S&P 500 lost 8.86 points, or 0.45 percent, to 1,970.05.
The Nasdaq Composite dropped 2.21 points, or 0.05 percent, to 4,442.70.


