Canola futures edged slightly higher on Wednesday, with support from soy oil and solid canola demand.
Based on soybean prices and the value of the Canadian dollar, it is still very profitable to crush canola so there is strong support for the oilseed.
Soybeans edged higher on good demand and on concern about dry, warm weather in Argentina. Conditions in Brazil are good.
Wheat futures fell on ample supply. Corn dipped on profit taking after hitting a four-week high on Tuesday.
CLICK HERE TO WATCH THIS WEEK’S CROP MARKET UPDATE
Read Also

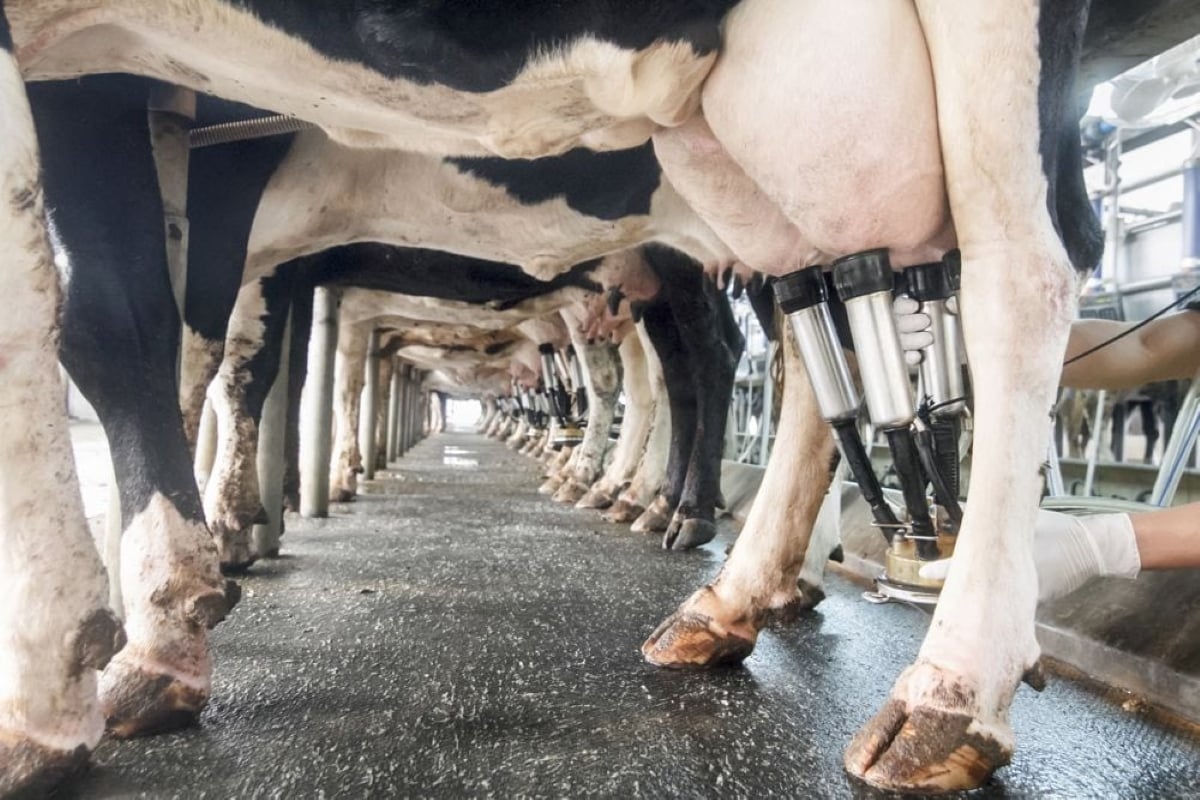
Farm gate milk price to rise in 2026
The Canadian Dairy Commission will raise its farm gate milk price by 2.3255 per cent in February, the Crown corporation announced on Friday.
Traders were also adjusting their positions ahead of the USDA’s monthly supply-demand report for December, due Friday. Analysts surveyed by Reuters on average expect the government to lower its forecast of U.S. 2016-17 soybean ending stocks and leave its figures for corn and wheat ending stocks nearly unchanged.
Markets generally are also preparing for the meeting of the U.S. Federal Reserve Dec. 13-14. The trade expects the central bank will increase U.S. interest rates.
Light crude oil nearby futures in New York Wednesday were down $1.16 to US$49.77 per barrel.
The Canadian dollar at noon was US75.46 cents, up from 75.30 cents the previous trading day. The U.S. dollar at noon was C$1.3252.
Stock markets rose strongly as buyers hope the U.S. economy will gather steam under a Trump presidency.
The Toronto Stock Exchange’s S&P/TSX composite index closed up 111.95 points, or 0.74 percent, at 15,237.75.
The Dow Jones industrial average rose 297.84 points, or 1.55 percent, to 19,549.62, the S&P 500 gained 29.12 points, or 1.32 percent, to 2,241.35 and the Nasdaq Composite added 60.76 points, or 1.14 percent, to 5,393.76.
Winnipeg ICE Futures Canada dollars per tonne
Canola Jan 2017 529.30 +0.60 +0.11%
Canola Mar 2017 535.20 +0.50 +0.09%
Canola May 2017 540.20 +0.10 +0.02%
Canola Jul 2017 541.90 +0.70 +0.13%
Canola Nov 2017 506.20 -2.20 -0.43%
Milling Wheat Dec 2016 231.00 -2.00 -0.86%
Milling Wheat Mar 2017 237.00 -1.00 -0.42%
Milling Wheat May 2017 239.00 -2.00 -0.83%
Durum Wheat Dec 2016 138.00 unch 0.00%
Durum Wheat Mar 2017 142.00 unch 0.00%
Durum Wheat May 2017 144.00 unch 0.00%
Barley Dec 2016 138.00 unch 0.00%
Barley Mar 2017 142.00 unch 0.00%
Barley May 2017 144.00 unch 0.00%
American crop prices in cents US/bushel, soybean meal in $US/short ton, soy oil in cents US/pound
Chicago
Soybeans Jan 2017 1049.00 +1.25 +0.12%
Soybeans Mar 2017 1059.50 +1.75 +0.17%
Soybeans May 2017 1066.75 +2.00 +0.19%
Soybeans Jul 2017 1072.00 +2.25 +0.21%
Soybeans Aug 2017 1068.50 +3.00 +0.28%
Soybeans Sep 2017 1049.00 +4.00 +0.38%
Soybean Meal Dec 2016 319.20 -1.00 -0.31%
Soybean Meal Jan 2017 320.50 -1.40 -0.43%
Soybean Meal Mar 2017 324.50 -0.60 -0.18%
Soybean Oil Dec 2016 37.72 +0.10 +0.27%
Soybean Oil Jan 2017 37.93 +0.11 +0.29%
Soybean Oil Mar 2017 38.21 +0.11 +0.29%
Corn Dec 2016 350.50 -0.50 -0.14%
Corn Mar 2017 358.00 -2.50 -0.69%
Corn May 2017 364.75 -2.50 -0.68%
Corn Jul 2017 371.75 -2.50 -0.67%
Corn Sep 2017 378.75 -2.25 -0.59%
Oats Dec 2016 213.50 +4.00 +1.91%
Oats Mar 2017 222.75 +4.25 +1.95%
Oats May 2017 226.50 +3.50 +1.57%
Oats Jul 2017 230.00 +2.50 +1.10%
Oats Sep 2017 235.25 +2.50 +1.07%
Wheat Dec 2016 386.25 -3.25 -0.83%
Wheat Mar 2017 401.00 -5.75 -1.41%
Wheat May 2017 412.50 -6.75 -1.61%
Wheat Jul 2017 424.75 -7.50 -1.74%
Wheat Sep 2017 438.75 -7.75 -1.74%
Minneapolis
Spring Wheat Dec 2016 534.00 -4.75 -0.88%
Spring Wheat Mar 2017 529.00 -5.00 -0.94%
Spring Wheat May 2017 532.25 -5.25 -0.98%
Spring Wheat Jul 2017 535.75 -5.50 -1.02%
Spring Wheat Sep 2017 541.75 -6.25 -1.14%
Kansas City
Hard Red Wheat Dec 2016 382.00 -5.00 -1.29%
Hard Red Wheat Mar 2017 400.00 -5.00 -1.23%
Hard Red Wheat May 2017 411.75 -5.00 -1.20%
Hard Red Wheat Jul 2017 423.75 -5.25 -1.22%
Hard Red Wheat Sep 2017 439.00 -5.00 -1.13%
Chicago livestock futures in US¢/pound (rounded to two decimal places)
Live Cattle (P) Dec 2016 109.38 -0.47 -0.43%
Live Cattle (P) Feb 2017 110.78 -0.27 -0.24%
Live Cattle (P) Apr 2017 110.80 -0.23 -0.21%
Feeder Cattle (P) Jan 2017 126.98 +0.13 +0.10%
Feeder Cattle (P) Mar 2017 123.80 +0.02 +0.02%
Feeder Cattle (P) Apr 2017 123.55 +0.10 +0.08%
Lean Hogs (P) Dec 2016 54.70 +1.33 +2.49%
Lean Hogs (P) Feb 2017 59.75 +2.28 +3.97%
Lean Hogs (P) Apr 2017 65.77 +2.15 +3.38%


