Canola edged lower Thursday on a stronger loonie and profit taking after the run up on Wednesday.
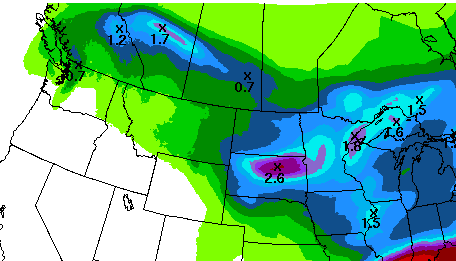
Dry and cool weather is limiting canola growth but rain is forecast in many areas over the next several days, although accumulations for most of the region are expected to be generally light.
The best chance for moisture could come from thunderstorms predicted to form Friday night with a chance of heavier rain around Edmonton and moving southeast, roughly along the Yellowhead Highway toward Saskatoon and on to Yorkton.
Read Also

U.S. livestock: Cattle fall sharply as Trump says he’s working to lower beef costs
Chicago cattle futures fell sharply on Friday after U.S. President Donald Trump said his administration was working to lower the…
The following week though looks dry. Analysts are already talking of a canola crop near 14 million tonnes, down about a million from Agriculture Canada’s May forecast. If the dry weather continues they yield forecasts would fall further.
Also supporting canola are concerns that wet weather in the U.S. Midwest will prevent soybean seeding in some fields or at least force reseeding.
Soybeans edged a little higher, but soybean oil fell, weakened due to long soymeal/short soyoil spreading. Cash market dealers said soyoil supplies were plentiful.
Corn edged lower on profit taking after recent gains. Also warmer weather is forecast for the Midwest toward the end of the month, which should benefit crop growth, given good soil moisture conditions.
Wheat fell on forecasts for drier weather next week in the U.S. southern plains, which should allow for the resumption of harvest. The forecast for rain in Western Canada also pressured wheat lower.
Markets generally were digesting Wednesday’s statement from the U.S. Federal Reserve. It disappointed those hoping for a clear indication that it would raise interest rates in September.
Federal Reserve chair Janet Yellen said member wanted to see more definite signs of sustained job growth and signs that inflation will rise to its target of two percent.
And a report today showed U.S. consumer prices in May recorded their largest increase in more than two years as gasoline prices surged, suggesting the drag on inflation from lower oil prices was fading.
The Toronto Stock Exchange’s S&P/TSX composite index closed up 37.66 points, or 0.26 percent, at 14,770.64. S
The Dow Jones industrial average rose 178.83 points, or one percent, to 18,114.57, the S&P 500 gained 20.57 points, or 0.98 percent, to 2,121.01 and the Nasdaq Composite added 68.07 points, or 1.34 percent, to 5,132.95 a new all time high.
Light crude oil nearby futures in New York were up 53 cents to US$60.45 per barrel.
The Canadian dollar at noon was US81.91 cents, up from 81.25 cents the previous trading day. The U.S. dollar at noon was C$1.2209.
Winnipeg ICE Futures Canada dollars per tonne
Canola Jul 2015 495.00 -2.00 -0.40%
Canola Nov 2015 493.90 -2.30 -0.46%
Canola Jan 2016 490.60 -1.40 -0.28%
Canola Mar 2016 487.40 -1.40 -0.29%
Canola May 2016 483.90 -1.20 -0.25%
Milling Wheat Jul 2015 208.00 -2.00 -0.95%
Milling Wheat Oct 2015 213.00 -2.00 -0.93%
Milling Wheat Dec 2015 213.00 -2.00 -0.93%
Durum Wheat Jul 2015 298.00 unch 0.00%
Durum Wheat Oct 2015 298.00 unch 0.00%
Durum Wheat Dec 2015 303.00 unch 0.00%
Barley Jul 2015 210.00 unch 0.00%
Barley Oct 2015 205.00 unch 0.00%
Barley Dec 2015 210.00 unch 0.00%
American crop prices in cents US/bushel, soybean meal in $US/short ton, soy oil in cents US/pound
Chicago
Soybeans Jul 2015 977.75 +8.75 +0.90%
Soybeans Aug 2015 960.5 +6.75 +0.71%
Soybeans Sep 2015 945.5 +3.75 +0.40%
Soybeans Nov 2015 942.25 +2.5 +0.27%
Soybeans Jan 2016 948 +2.25 +0.24%
Soybeans Mar 2016 949.5 +1.5 +0.16%
Soybean Meal Jul 2015 326.6 +2.9 +0.90%
Soybean Meal Aug 2015 319.2 +4 +1.27%
Soybean Meal Sep 2015 313.7 +3.7 +1.19%
Soybean Oil Jul 2015 32.25 -0.6 -1.83%
Soybean Oil Aug 2015 32.34 -0.6 -1.82%
Soybean Oil Sep 2015 32.41 -0.61 -1.85%
Corn Jul 2015 358 -1.25 -0.35%
Corn Sep 2015 363.5 -1.75 -0.48%
Corn Dec 2015 373.25 -1.75 -0.47%
Corn Mar 2016 384.5 -1.75 -0.45%
Corn May 2016 391.75 -1.5 -0.38%
Oats Jul 2015 250.75 -4.25 -1.67%
Oats Sep 2015 258.75 -3 -1.15%
Oats Dec 2015 265 -2.75 -1.03%
Oats Mar 2016 270.75 -2 -0.73%
Oats May 2016 277.5 -2 -0.72%
Wheat Jul 2015 488 -3.25 -0.66%
Wheat Sep 2015 493.25 -3.75 -0.75%
Wheat Dec 2015 507.25 -3.5 -0.69%
Wheat Mar 2016 521.25 -2.75 -0.52%
Wheat May 2016 529.5 -2.75 -0.52%
Minneapolis Spring
Wheat Jul 2015 539.75 -8 -1.46%
Wheat Sep 2015 550.5 -6.75 -1.21%
Wheat Dec 2015 563.75 -6.5 -1.14%
Wheat Mar 2016 577.5 -6.25 -1.07%
Wheat May 2016 586.25 -6.25 -1.05%
Kansas City Hard Red
Wheat Jul 2015 498.25 -7.25 -1.43%
Wheat Sep 2015 507.75 -7 -1.36%
Wheat Dec 2015 526.75 -7 -1.31%
Wheat Mar 2016 540.5 -6.75 -1.23%
Wheat May 2016 549.5 -6.5 -1.17%