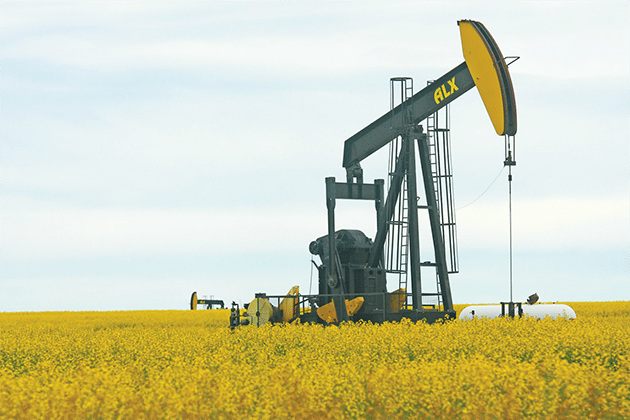
 Canola futures threw off early weakness to close up slightly with support from soy oil as crude oil rose again, topping $50 a barrel in New York.
Gains in canola were limited by the rising Canadian dollar, which climbed about a half cent to top US75 cents.
Reuters surveyed traders who on average put Canada’s canola crop at 18.8 million tonnes. Statistics Canada comes out with its official crop size estimates on Tuesday.
Read Also

Canada and China discuss disputes over canola and EVs, says Ottawa
Senior Canadian and Chinese officials discussed bilateral trade disputes involving canola and electric vehicles on Friday, Ottawa said, but gave no indication of any immediate breakthrough.
If true, that would mark a record-large Canadian canola crop.
Trade forecasts ranged from 18 to19.6 million tonnes, Last year’s crop was 18.38 million tonnes.
WATCH THIS WEEK’S VIDEO MARKETS UPDATE
Reuters also reported that Algeria bought at least 120,000 tonnes of durum, and perhaps as much as 150,000 tonnes.
The details were not published, but European traders believe the price was around US$310 to $315 a tonne, cost and freight included and source was believed to be mainly from Canada, along with one cargo from the United States.
Chicago corn and soybeans were lower. Chicago and Kansas wheat were also lower but Minneapolis spring wheat edged up a few cents per bushel.
Soy meal was also down, but soy oil climbed more than two percent, supported by the rise in crude oil.
Crude rose as traders welcomed the news Wednesday that OPEC had agreed to trim production to try to eliminate the oversupply in the world.
The USDA reported weekly export sales of U.S. soybeans at 1,399,000 tonnes, at the high end of a range of trade expectations for one million to 1.4 million tonnes.
Export sales of U.S. corn were 761,600 tonnes, below a range of trade expectations for 900,000 to 1,200,000 tonnes.
Wheat exports were 483,500 tonnes, in line with trade expectations for 300,000 to 500,000 tonnes.
OUTSIDE MARKETS
Light crude oil nearby futures in New York rose $1.62 to US$51.06 per barrel.
The Canadian dollar at noon was US75.01 cents, up from 74.48 cents the previous trading day. The U.S. dollar at noon was C$1.3331.
The TSX composite fell 55.32 points or 0.37 percent to close at 15,027.53.
The Dow Jones industrial average rose 68.35 points, or 0.36 percent, to 19,191.93, the S&P 500 lost 7.73 points, or 0.35 percent, to 2,191.08 and the Nasdaq Composite dropped 72.57 points, or 1.36 percent, to 5,251.11.
Winnipeg ICE Futures Canada dollars per tonne
Canola Jan 2017 527.70 +2.50 +0.48%
Canola Mar 2017 534.30 +1.80 +0.34%
Canola May 2017 538.40 +0.80 +0.15%
Canola Jul 2017 538.30 +0.90 +0.17%
Canola Nov 2017 510.20 +1.40 +0.28%
Milling Wheat Mar 2017 239.00 +1.00 +0.42%
Milling Wheat May 2017 241.00 +1.00 +0.42%
Milling Wheat Jul 2017 242.00 +1.00 +0.41%
Durum Wheat Mar 2017 323.00 unch 0.00%
Durum Wheat May 2017 326.00 unch 0.00%
Durum Wheat Jul 2017 327.00 unch 0.00%
Barley Mar 2017 142.00 unch 0.00%
Barley May 2017 144.00 unch 0.00%
Barley Jul 2017 145.00 unch 0.00%
American crop prices in cents US/bushel, soybean meal in $US/short ton, soy oil in cents US/pound
Chicago
Soybeans Jan 2017 1029.75 -2.50 -0.24%
Soybeans Mar 2017 1039.00 -2.25 -0.22%
Soybeans May 2017 1045.50 -3.50 -0.33%
Soybeans Jul 2017 1050.25 -3.75 -0.36%
Soybeans Aug 2017 1046.50 -4.50 -0.43%
Soybeans Sep 2017 1028.50 -4.25 -0.41%
Soybean Meal Dec 2016 310.90 -5.50 -1.74%
Soybean Meal Jan 2017 312.70 -5.60 -1.76%
Soybean Meal Mar 2017 315.60 -5.50 -1.71%
Soybean Oil Dec 2016 37.64 +0.85 +2.31%
Soybean Oil Jan 2017 37.85 +0.86 +2.32%
Soybean Oil Mar 2017 38.12 +0.87 +2.34%
Corn Dec 2016 331.75 -5.00 -1.48%
Corn Mar 2017 342.50 -6.00 -1.72%
Corn May 2017 350.00 -5.75 -1.62%
Corn Jul 2017 357.75 -5.75 -1.58%
Corn Sep 2017 365.50 -5.25 -1.42%
Oats Dec 2016 200.25 +1.00 +0.50%
Oats Mar 2017 215.25 +3.00 +1.41%
Oats May 2017 219.25 +2.50 +1.15%
Oats Jul 2017 220.25 +0.50 +0.23%
Oats Sep 2017 224.50 +3.25 +1.47%
Wheat Dec 2016 371.50 -9.00 -2.37%
Wheat Mar 2017 395.50 -7.25 -1.80%
Wheat May 2017 408.75 -6.75 -1.62%
Wheat Jul 2017 424.00 -7.25 -1.68%
Wheat Sep 2017 440.00 -7.25 -1.62%
Minneapolis
Spring Wheat Dec 2016 541.00 +1.50 +0.28%
Spring Wheat Mar 2017 538.50 +4.00 +0.75%
Spring Wheat May 2017 540.75 +4.00 +0.75%
Spring Wheat Jul 2017 543.50 +2.75 +0.51%
Spring Wheat Sep 2017 549.75 +2.00 +0.37%
Kansas City
Hard Red Wheat Dec 2016 384.00 -7.25 -1.85%
Hard Red Wheat Mar 2017 403.00 -7.25 -1.77%
Hard Red Wheat May 2017 415.00 -7.00 -1.66%
Hard Red Wheat Jul 2017 426.50 -6.50 -1.50%
Hard Red Wheat Sep 2017 441.25 -6.50 -1.45%
Chicago livestock futures in US¢/pound (rounded to two decimal places)
Live Cattle (P) Dec 2016 110.58 -0.17 -0.15%
Live Cattle (P) Feb 2017 111.38 -0.57 -0.51%
Live Cattle (P) Apr 2017 111.22 -0.50 -0.45%
Feeder Cattle (P) Jan 2017 127.78 -0.65 -0.51%
Feeder Cattle (P) Mar 2017 124.25 -0.20 -0.16%
Feeder Cattle (P) Apr 2017 124.02 -0.11 -0.09%
Lean Hogs (P) Dec 2016 50.22 -0.81 -1.59%
Lean Hogs (P) Feb 2017 54.07 -1.16 -2.10%
Lean Hogs (P) Apr 2017 60.45 -1.05 -1.71%


