Canola bounced slightly higher Tuesday following the sharp 3.6 percent crash on Monday, the biggest one day loss in 6 ½ months.
Improving moisture in the Canadian Prairies and weaker soybeans due to improved growing weather in the U.S. Midwest were behind Monday’s big drop. Also, markets generally were nervous about China’s economy and the 8.5 percent fall in the Shanghai market’s composite index on Monday
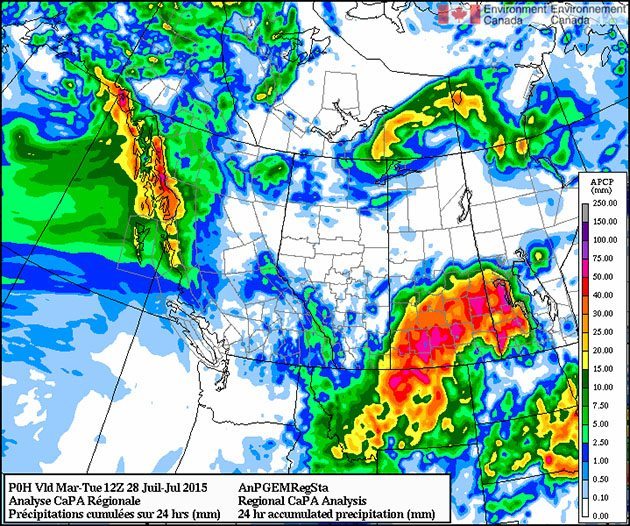
Much of Saskatchewan’s grain belt and parts of Manitoba received rain Monday and today with the wettest areas getting downpours of five inches or more.
Read Also

U.S. grains: Soy, corn futures weaken on harvest pressure, firm dollar
Chicago | Reuters – U.S. soybean and corn futures fell on Thursday on seasonal pressure as the harvest expanded in…
Violent storms accompanied the rain in Manitoba and parts of eastern Saskatchewan. Lodging will be a problem in some areas following the heavy rain.
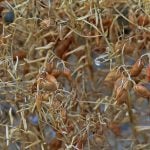
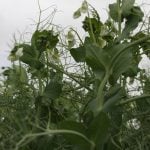
The rain will also present a delay for the few producers were just starting to harvest early crops such as peas.
The CWB tour last week estimated Canada’s canola crop at 12.49 million tonnes, down from 15.5 million last year.
It pegged the spring wheat crop at 18.14 million tonnes, down from last year’s 20.88 million.
Durum was forecast at 4.19 million tonnes, down from 5.19 last year.
Most U.S. crop futures Tuesday bounced back a little on technical factors and bargain buying after Monday’s sharp losses.
Reuters reported soybeans received support from the U.S. Department of Agriculture crop condition report on Monday that showed national good-to-excellent ratings for the crop held steady compared with market expectations for a slight improvement.
The condition of U.S. corn improved slightly with 70 percent of the crop rated good to excellent as compared with 69 percent the week before, although it was still well below the 75 percent seen a year ago, the USDA said.
Stock markets were on track to break a five day losing streak with bargain buying a feature and also speculation that lingering economic weakness might cause the U.S. Federal Reserve to push back an interest rate increase to its December meeting.
Light crude oil nearby futures in New York was up 59 cents to US$47.98 per barrel.
The Canadian dollar at noon was US77.32 cents, up from 76.87 cents the previous trading day. The U.S. dollar at noon was C$1.2934.
Unofficially, the TSX composite rose 75.99 points or 0.54 percent to close at 14.077.36
The Dow Jones industrial average rose 189.94 points, or 1.09 percent, to 17,630.53, the S&P 500 gained 25.63 points, or 1.24 percent, to 2,093.27 and the Nasdaq Composite added 49.43 points, or 0.98 percent, to 5,089.21.
Winnipeg ICE Futures Canada dollars per tonne
Canola Nov 2015 492.80 +2.30 +0.47%
Canola Jan 2016 492.80 +1.80 +0.37%
Canola Mar 2016 492.40 +3.20 +0.65%
Canola May 2016 488.40 +3.20 +0.66%
Canola Jul 2016 482.50 +2.50 +0.52%
Milling Wheat Oct 2015 222.00 +1.00 +0.45%
Milling Wheat Dec 2015 222.00 +1.00 +0.45%
Milling Wheat Mar 2016 226.00 +1.00 +0.44%
Durum Wheat Oct 2015 335.00 unch 0.00%
Durum Wheat Dec 2015 345.00 unch 0.00%
Durum Wheat Mar 2016 360.00 unch 0.00%
American crop prices in cents US/bushel, soybean meal in $US/short ton, soy oil in cents US/pound
Chicago
Barley Oct 2015 208.10 -2.00 -0.95%
Barley Dec 2015 208.10 -2.00 -0.95%
Barley Mar 2016 210.10 -2.00 -0.94%
Soybeans Aug 2015 974.75 +13.5 +1.40%
Soybeans Sep 2015 954 +14.75 +1.57%
Soybeans Nov 2015 944.75 +11.5 +1.23%
Soybeans Jan 2016 950.75 +11.25 +1.20%
Soybeans Mar 2016 949.5 +12 +1.28%
Soybeans May 2016 945.5 +12.25 +1.31%
Soybean Meal Aug 2015 345.2 +1 +0.29%
Soybean Meal Sep 2015 336.1 +0.9 +0.27%
Soybean Meal Oct 2015 326.7 +2.4 +0.74%
Soybean Oil Aug 2015 30.66 +0.55 +1.83%
Soybean Oil Sep 2015 30.76 +0.56 +1.85%
Soybean Oil Oct 2015 30.86 +0.58 +1.92%
Corn Sep 2015 375 +2 +0.54%
Corn Dec 2015 385.5 +2 +0.52%
Corn Mar 2016 396.5 +2.25 +0.57%
Corn May 2016 402.5 +2.25 +0.56%
Corn Jul 2016 408 +2.75 +0.68%
Oats Sep 2015 230.5 +4.5 +1.99%
Oats Dec 2015 242.25 +3.5 +1.47%
Oats Mar 2016 253.75 +3 +1.20%
Oats May 2016 258.5 +3 +1.17%
Oats Jul 2016 259.5 +3 +1.17%
Wheat Sep 2015 510.75 +8.25 +1.64%
Wheat Dec 2015 520.25 +8.5 +1.66%
Wheat Mar 2016 528.25 +9 +1.73%
Wheat May 2016 532.75 +9.25 +1.77%
Wheat Jul 2016 535 +9.5 +1.81%
Minneapolis
Spring Wheat Sep 2015 540.25 +3.25 +0.61%
Spring Wheat Dec 2015 557.5 +3 +0.54%
Spring Wheat Mar 2016 574 +3 +0.53%
Spring Wheat May 2016 584.25 +2.75 +0.47%
Spring Wheat Jul 2016 593.75 +3.25 +0.55%
Kansas City
Hard Red Wheat Sep 2015 504.75 +5.5 +1.10%
Hard Red Wheat Dec 2015 524.5 +5.25 +1.01%
Hard Red Wheat Mar 2016 538.5 +5 +0.94%
Hard Red Wheat May 2016 547.75 +4.75 +0.87%
Hard Red Wheat Jul 2016 555.5 +5.5 +1.00%