November canola managed to break $500, rising to $502.80 before setting in at $500.80 after starting the day at $493.90. The big jump was on the coat tails of soybeans, which grew by about 3 percent on the day, as traders began acting on rumours of Chinese and American trade discussions. August soybeans cleared US$ 9 to settle in at $9.03-75.
Drought remains in the trade’s minds as the USDA’s crop condition report shows the condition of the spring wheat crop in that country is slipping slightly. But that was not the only thing on their minds. The big Swedish farmers’ co-op, Lantmannen, forecast Sweden’s 2018 harvest of grains and oilseeds to fall to the lowest level in 26 years, down to 4.2 million tonnes, 2 million lower than the five-year average. While Sweden is not a large exporter of wheat, it will grow 40 percent less this year, shorting some higher-end markets in Europe, and will likely become a net importer itself.
Read Also
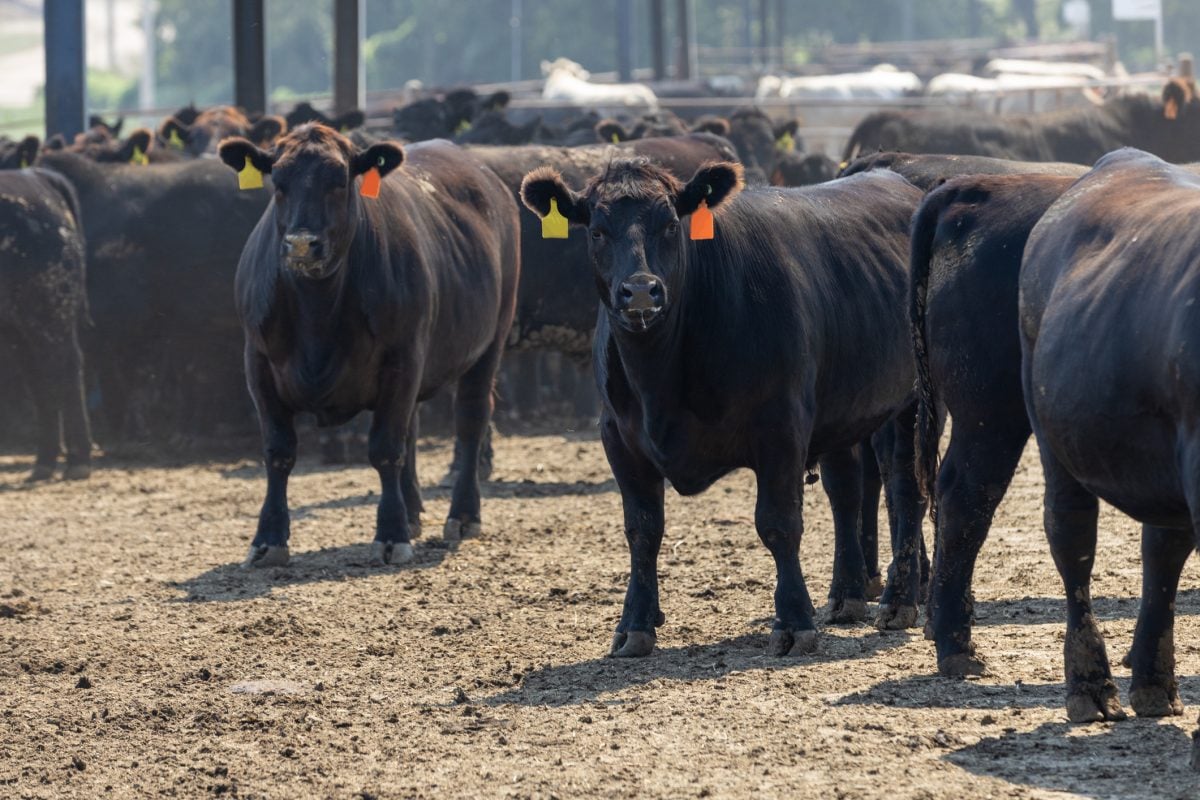
U.S. livestock: Feeder cattle hit contract highs on tight supply
Chicago | Reuters – All Chicago Mercantile Exchange feeder cattle futures and most live cattle futures hit contract highs on…
German drought and high summer temperatures have hit that country’s crop, the Ukraine is down by an estimated 12 percent and later-season rains in the region have hurt quality of the ongoing harvest in some places.
Corn continues to rise in the market, possibly lifted by wheat, with September corn on Chicago finishing up a nickle per bushel to US$ 3.7225. This was despite the USDA’s crop condition report for the past week suggesting that there was no loss in yield, despite dry conditions and higher temperatures.
| Name / Contract | High | Low | Last | Change | Settlement |
| Canola Nov 2018 (updated 1:19PM(CST) on 7/31/2018) | 502.80 | 492.40 | 500.80 | 7.00 | 500.80 |
| Canola Jan 2019 (updated 1:19PM(CST) on 7/31/2018) | 509.30 | 502.10 | 507.40 | 6.80 | 507.40 |
| Canola Mar 2019 (updated 1:17PM(CST) on 7/31/2018) | 514.40 | 507.50 | 512.80 | 7.00 | 512.80 |
| Canola May 2019 (updated 1:17PM(CST) on 7/31/2018) | 517.90 | 512.80 | 516.90 | 6.70 | 516.90 |
| Canola July 2019 (updated 1:17PM(CST) on 7/31/2018) | 519.50 | 514.30 | 519.50 | 7.30 | 519.50 |
| Soybeans Aug 2018 | 906.00 | 873.25 | 902.75 | 27.75 | 903.75 |
| Soybeans Sep 2018 | 912.00 | 878.50 | 907.50 | 26.75 | 908.75 |
| Soybeans Nov 2018 | 922.25 | 888.75 | 918.00 | 27.00 | 919.00 |
| Soybeans Jan 2019 | 932.75 | 899.25 | 929.00 | 27.50 | 929.50 |
| Soybeans Mar 2019 | 941.75 | 908.75 | 937.75 | 27.00 | 938.50 |
| Soybeans May 2019 | 950.00 | 918.00 | 946.75 | 26.75 | 947.25 |
| Soybean Meal Aug 2018 | 342.60 | 333.30 | 341.20 | 7.30 | 341.20 |
| Soybean Meal Sep 2018 | 341.50 | 332.20 | 340.00 | 7.10 | 339.90 |
| Soybean Meal Oct 2018 | 341.80 | 332.40 | 340.10 | 7.10 | 340.20 |
| Soybean Oil Aug 2018 | 28.80 | 28.32 | 28.74 | 0.43 | 28.73 |
| Soybean Oil Sep 2018 | 28.97 | 28.47 | 28.87 | 0.41 | 28.89 |
| Soybean Oil Oct 2018 | 29.10 | 28.59 | 29.00 | 0.42 | 29.01 |
| Corn Sep 2018 | 374.25 | 366.25 | 372.25 | 5.00 | 372.25 |
| Corn Dec 2018 | 388.50 | 380.25 | 386.25 | 5.00 | 386.50 |
| Corn Mar 2019 | 398.75 | 390.75 | 397.00 | 5.25 | 397.00 |
| Corn May 2019 | 404.25 | 396.50 | 401.75 | 4.50 | 402.25 |
| Corn Jul 2019 | 409.25 | 401.25 | 406.75 | 4.75 | 406.75 |
| Oats Sep 2018 | 237.75 | 232.25 | 236.00 | 3.25 | 235.75 |
| Oats Dec 2018 | 246.00 | 242.00 | 245.75 | 3.00 | 245.75 |
| Oats Mar 2019 | 249.00 | 249.00 | 250.00 | 2.75 | 250.00 |
| Oats May 2019 | 252.75 | 252.75 | 252.75 | 3.75 | 252.75 |
| Oats Jul 2019 | 256.00 | 256.00 | 256.00 | 3.50 | 256.00 |
| Wheat Sep 2018 | 565.00 | 540.50 | 554.50 | 8.00 | 553.75 |
| Wheat Dec 2018 | 584.50 | 560.75 | 574.25 | 7.75 | 573.25 |
| Wheat Mar 2019 | 598.50 | 576.00 | 588.75 | 7.00 | 587.75 |
| Wheat May 2019 | 603.00 | 581.50 | 593.75 | 6.25 | 592.75 |
| Wheat Jul 2019 | 601.50 | 581.25 | 593.00 | 5.50 | 592.25 |
| Spring Wheat Sep 2018 | 614.50 | 598.00 | 606.25 | 5.25 | 606.25 |
| Spring Wheat Dec 2018 | 629.00 | 612.50 | 622.75 | 7.25 | 622.75 |
| Spring Wheat Mar 2019 | 641.00 | 627.00 | 635.75 | 6.75 | 635.75 |
| Spring Wheat May 2019 | 646.25 | 640.00 | 642.75 | 7.25 | 642.75 |
| Spring Wheat Jul 2019 | 653.75 | 644.50 | 648.75 | 6.75 | 648.75 |
| Hard Red Wheat Sep 2018 | 564.25 | 542.75 | 556.25 | 8.50 | 556.50 |
| Hard Red Wheat Dec 2018 | 591.00 | 570.00 | 584.00 | 9.25 | 584.25 |
| Hard Red Wheat Mar 2019 | 607.00 | 587.00 | 600.75 | 9.25 | 601.00 |
| Hard Red Wheat May 2019 | 612.75 | 594.00 | 606.25 | 8.75 | 606.25 |
| Hard Red Wheat Jul 2019 | 613.00 | 593.50 | 606.00 | 8.00 | 605.75 |
| Live Cattle (P) Aug 2018 | 108.50 | 107.55 | 107.68 | -0.74 | 107.68 |
| Live Cattle (P) Oct 2018 | 110.15 | 108.80 | 109.30 | -0.50 | 109.30 |
| Live Cattle (P) Dec 2018 | 113.88 | 112.50 | 112.98 | -0.47 | 112.98 |
| Feeder Cattle (P) Aug 2018 | 151.50 | 148.88 | 149.32 | -2.18 | 149.32 |
| Feeder Cattle (P) Sep 2018 | 151.43 | 148.88 | 149.58 | -1.77 | 149.58 |
| Feeder Cattle (P) Oct 2018 | 151.80 | 149.08 | 149.95 | -1.83 | 149.95 |
| Lean Hogs (P) Aug 2018 | 64.02 | 60.88 | 61.12 | -2.18 | 61.12 |
| Lean Hogs (P) Oct 2018 | 51.55 | 50.12 | 50.72 | -0.51 | 50.72 |
| Lean Hogs (P) Dec 2018 | 46.90 | 45.92 | 46.55 | -0.05 | 46.55 |
| Canadian Dollar Aug 2018 | 0.7696 | 0.7644 | 0.7694 | 0.0013 | 0.7695 |
| Crude Sep 2018 | 70.22 | 68.48 | 68.69 | -1.44 | 68.76 |