Most canola futures rose slightly on Thursday, supported by rising soybeans, slow harvest progress and technical strength.
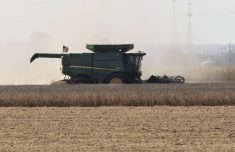
Today’s Saskatchewan crop report said 80 percent of the province’s canola crop was in the bin, up only two percentage points from the week before.
The harvest of all crops stands at 82 percent combined, up only one percent over the past week.
Only about half of the canaryseed and flax have been combined and only 25 percent of the chickpeas are in the bin.
Peas and lentils are mostly complete, spring wheat is at 81 percent and durum at 77 percent.
Read Also
Grain trader Bunge lowers 2025 profit forecast after closing Viterra deal
U.S. grain trader and processor Bunge on Wednesday lowered its 2025 earnings forecast following its merger with Viterra, and said it is overhauling segment and volume reporting to align with its integrated operations.
Barley is at 89 percent done and oats are at 76 percent.
The southeast is 90 percent complete. Most other areas are 80 to 85 percent complete and the west central region is furthest behind at only 73 percent complete.
The northeastern grain belt of Saskatchewan, around Hudson Bay and northern Manitoba could see significant precipitation accumulations in the next 24 hours.
CLICK HERE FOR OUR WEEKLY VIDEO CROP MARKET UPDATE
U.S. markets were generally higher, supported by an infusion of investment fund money.
Soy rose on good weekly U.S. export sales, about in the middle of the range of analyst expectations.
U.S. soybean exports are up 26 percent compared to the last year at this time. That is well above USDA’s estimate for a five percent increase.
Rising soymeal futures also supported soybeans. Meal was helped by good commercial demand. Soy oil fell as the trade unwinds long soyoil-short soymeal spreads.
Some analysts think the soy complex rally might be on shaky ground as the cash market indicates that soy supply is ample. Also, the next USDA supply and demand report on Nov. 9 could upgrade the soybean production forecast.
Corn rose on fund buying even though weekly exports sales fell short of expectations.
U.S. wheat export sales topped analysts’ expectations and wheat futures rose a few pennies per bushel.
Oats futures are on quite a tear with the December contract up almost eight percent today and up about 53 cents or 30 percent since the start of October.
The rise in oats is likely linked to the slow Canadian harvest.
Light crude oil nearby futures in New York were up 54 cents to US$49.72 per barrel.
The Canadian dollar at noon was US74.70 cents, down from 74.85 cents the previous trading day. The U.S. dollar at noon was C$1.3386
The Toronto Stock Exchange’s S&P/TSX composite index closed up 26.19 points, or 0.18 percent, at 14,833.75.
The Dow Jones industrial average fell 29.65 points, or 0.16 percent, to 18,169.68, the S&P 500 lost 6.39 points, or 0.3 percent, to 2,133.04 and the Nasdaq Composite dropped 34.29 points, or 0.65 percent, to 5,215.97.
Winnipeg ICE Futures Canada dollars per tonne
Canola Nov 16 510.20s unch unch
Canola Jan 17 519.50s +1.30 +0.25%
Canola Mar 17 524.70s +1.40 +0.27%
Canola May 17 527.30s +1.50 +0.29%
Canola Jul 17 526.90s +1.40 +0.27%
Milling Wheat Dec 16 237.00s unch unch
Milling Wheat Mar 17 242.00s +1.00 +0.41%
Milling Wheat May 17 245.00s unch unch
Durum Wheat Dec 16 313.00s unch unch
Durum Wheat Mar 17 318.00s unch unch
Durum Wheat May 17 322.00s unch unch
Barley Dec 16 132.50s unch unch
Barley Mar 17 134.50s unch unch
Barley May 17 135.50s unch unch
American crop prices in cents US/bushel, soybean meal in $US/short ton, soy oil in cents US/pound
Chicago
Soybeans Nov 2016 1014.25 +4.25 +0.42%
Soybeans Jan 2017 1025.00 +4.00 +0.39%
Soybeans Mar 2017 1031.25 +3.00 +0.29%
Soybeans May 2017 1036.25 +2.00 +0.19%
Soybeans Jul 2017 1040.25 +1.50 +0.14%
Soybeans Aug 2017 1037.50 +1.50 +0.14%
Soybean Meal Dec 2016 327.60 +8.50 +2.66%
Soybean Meal Jan 2017 328.60 +8.30 +2.59%
Soybean Meal Mar 2017 328.90 +7.40 +2.30%
Soybean Oil Dec 2016 35.11 -0.61 -1.71%
Soybean Oil Jan 2017 35.32 -0.64 -1.78%
Soybean Oil Mar 2017 35.44 -0.69 -1.91%
Corn Dec 2016 357.50 +3.50 +0.99%
Corn Mar 2017 366.25 +3.00 +0.83%
Corn May 2017 373.00 +3.00 +0.81%
Corn Jul 2017 379.50 +3.00 +0.80%
Corn Sep 2017 385.75 +3.00 +0.78%
Oats Dec 2016 232.00 +17.00 +7.91%
Oats Mar 2017 224.00 +12.25 +5.79%
Oats May 2017 222.75 +10.75 +5.07%
Oats Jul 2017 224.50 +10.50 +4.91%
Oats Sep 2017 219.75 unch 0.00%
Wheat Dec 2016 414.50 +3.00 +0.73%
Wheat Mar 2017 433.50 +1.50 +0.35%
Wheat May 2017 448.75 +1.50 +0.34%
Wheat Jul 2017 462.50 +2.00 +0.43%
Wheat Sep 2017 478.25 +2.25 +0.47%
Minneapolis
Spring Wheat Dec 2016 525.50 unch 0.00%
Spring Wheat Mar 2017 531.50 +0.50 +0.09%
Spring Wheat May 2017 538.75 +0.25 +0.05%
Spring Wheat Jul 2017 545.50 +0.75 +0.14%
Spring Wheat Sep 2017 552.50 +1.00 +0.18%
Kansas
Hard Red Wheat Dec 2016 417.00 unch 0.00%
Hard Red Wheat Mar 2017 435.00 +0.25 +0.06%
Hard Red Wheat May 2017 447.00 +0.50 +0.11%
Hard Red Wheat Jul 2017 458.25 +0.75 +0.16%
Hard Red Wheat Sep 2017 472.00 +0.75 +0.16%
Live Cattle (P) Oct 2016 104.12 +1.07 +1.04%
Live Cattle (P) Dec 2016 105.15 +0.75 +0.72%
Live Cattle (P) Feb 2017 105.55 +0.40 +0.38%
Feeder Cattle (P) Oct 2016 121.92 -0.05 -0.04%
Feeder Cattle (P) Nov 2016 123.88 -0.05 -0.04%
Feeder Cattle (P) Jan 2017 118.52 +0.17 +0.14%
Lean Hogs (P) Dec 2016 45.38 +1.18 +2.67%
Lean Hogs (P) Feb 2017 52.32 +1.20 +2.35%
Lean Hogs (P) Apr 2017 59.88 +1.21 +2.06%