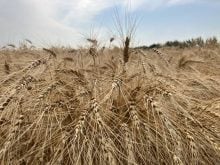
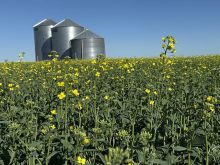
All the signs seem set for canola prices to soar ever higher.
Biodiesel demand is up.
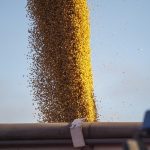
Soybean production worldwide is expected to fall.
Lots of market gurus say it’s agricultural commodities’ turn to shine.
So why would you consider locking in a price for your next crop, whether it’s before you seed it, while it’s growing or after it’s in the bin next fall? After all, in a booming market, why not just ride the wave higher? Where’s the danger?
Apart from the reasonable, practical and totally sane reason of prudent financial management, there are more technical but equally compelling reasons.
Read Also

Huge Black Sea flax crop to provide stiff competition
Russia and Kazakhstan harvested huge flax crops and will be providing stiff competition in China and the EU.
Canola prices are starting to float up into a frothy price range that has not often been reached and has never been retained for long.
As the accompanying chart provided by Mike Jubinville of Pro Farmer Canada shows, canola rarely reaches above $400 per tonne, and when it does, it tends to gyrate around in a stomach-churning manner.
And the price almost never reaches above $450 per tonne, at least not for long. If you managed to catch that blip in the mid-1990s, you were faster than almost everyone. As suddenly as it broke through to that level, it crashed back to where the market was more comfortable, which is $400-$450 per tonne as a peak. It seems as if canola is smacking its head against a brick wall or into a glass ceiling.
For whatever reason, getting beyond $450 per tonne for more than an instant has not been possible in canola’s history.
That’s not to say it couldn’t happen this time. Canola prices are reaching up, up, up and there seems to be no fundamental reason to explain why it would be impossible to reach above $450 and comfortably rest at a new plateau. Every new record range has to begin some time.
But the spooky thing about markets is that the fundamentals often aren’t apparent until after they have ceased to matter. Technical indicators often reveal more, but why they’re indicating what they’re indicating is often mysterious. To follow technical indicators requires a leap of faith.
Some brilliant fundamental investors completely ignore them and scorn their value. Warren Buffet, for example, thinks studying charts is a waste of time.
But as technical analysis has developed from a sketchy craft in the early 20th century to the complex science of today, more evidence has shown that some technical indicators work more often than they fail.
One of the simplest indicators is the charting of lines of support and resistance, which appear on the chart. The inability of the canola market to sustain prices above $450 is apparent going back more than 20 years.
The diffciulty of the price dropping below $250 is also clear. Wouldn’t you have liked to realize that when you sold canola in early 2005 for $240 per tonne?
Canola can move above $400 per tonne, but only for a limited time.
Is it because the high prices strangle demand, forcing users to move to different products? Or is it because the buyers believe the price is unsustainable and so won’t bid any higher, creating a self-fulfilling prophecy?
A fundamental analyst might hazard a guess; a technical analyst would say it doesn’t matter.
The chart suggests that canola at $400 to $450 per tonne is as high as canola tends to get, so refusing to sell anything until canola gets to $500 seems financial suicide.
Jubinville said a booming market like today’s tends to offer four to six spikes over a year.
He doesn’t try to pick the ultimate peak. He tries to sell some on each surge, and sell near the top of the range. No one will be able to peg the peak until it is gone.
As canola moves toward a historically peaky range, producers can look forward to exciting and profitable prices.
But as a caution to greed, look at this chart and beware.
We’ve been here before.