Yield monitors based on a global positioning system can make on-farm field research easier to manage at harvest time, but a farmer from Carman, Man., says plot planning is critical to produce useful test results.
Brent VanKoughnet, who also runs the agricultural consulting firm AgriSkills Inc., said if he’s using a yield monitor to evaluate trials, he wants to have one direction in the trial where he can compare monitor results to hard weights to verify that the yield monitor is on the money. Hard weights can be a weigh wagon or a truck running over a scale.
Read Also
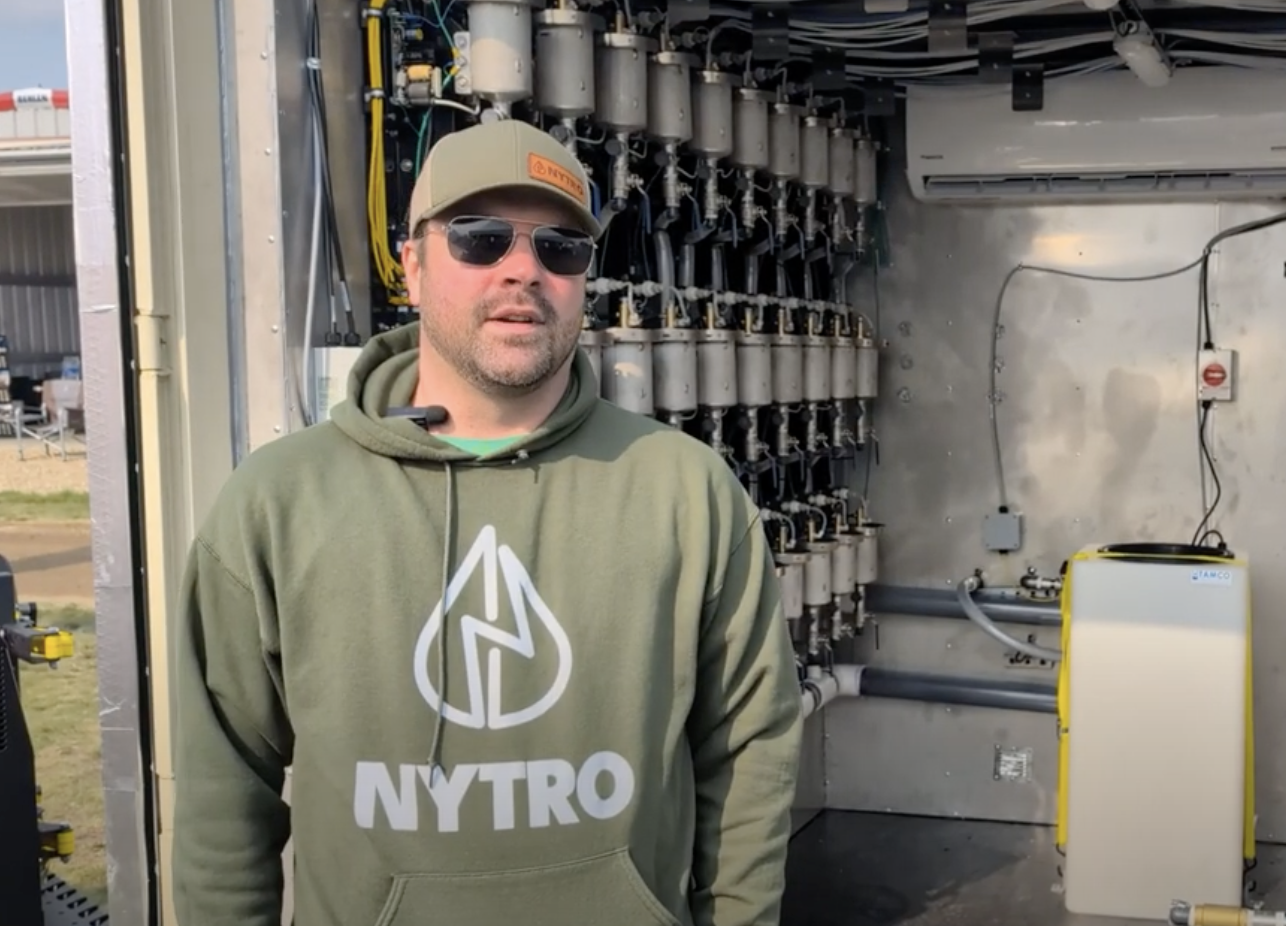
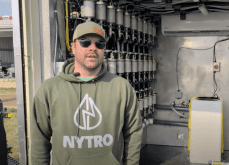
VIDEO: Green Lightning and Nytro Ag win sustainability innovation award
Nytro Ag Corp and Green Lightning recieved an innovation award at Ag in Motion 2025 for the Green Lightning Nitrogen Machine, which converts atmospheric nitrogen into a plant-usable form.
“Although yield monitors are pretty good relative-wise, sometimes they can drift around based on moisture content, (seed size), or if it goes through the combine a little differently. I always like to have a bunch of hard weights to verify that the yield monitor is working,” VanKoughnet said.
“If you’re going to do trials in two different directions to pick up the interaction, then you have to make sure that in at least one direction, that yield monitor is working.”
When VanKoughnet sets up a field trial, he makes sure the primary concern he’s testing runs in the same direction he plans to harvest the field.
“I can have my hard weights connected to that and I have the highest level of confidence in those results. And I’m going to replicate things to make sure it isn’t one freaky strip that used to be a fenceline or those things that can interact with a field trial.”
He replicates four times, although three will work.
“Your confidence level multiplies so rapidly with multiple strips versus a ‘cut a field in half’ design.”
If he wanted to see how three seeding rates behave in high and low nitrogen, VanKoughnet said he would run three strips of nitrogen at right angles to his seeding rate. If seeding rate is the key issue, then that’s the way he would combine. The strips of extra nitrogen would be applied separately.
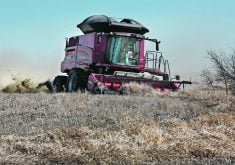
“I want to make sure those strips are wide enough that I’m comfortable as the combine comes through them, I’ve picked up a solid sample of what the yield was before I got in the strip, a buffer zone where there’s a bit of both in the combine, then a solid strip of where the extra nitrogen is, a buffer coming out and a solid strip of no nitrogen again,” he said. “One of the reasons I say a good solid strip is, it depends how fast I’m combining. There’s a time delay.” The strip can be 45 metres when he harvests at five km-h with his smaller combine, with his yield monitor capturing 10 samples in that strip at one sample every two seconds. However, if he’s using a Lexion combine and moving at 10.5 km-h, it’s better to use 75 metre strips, “to make sure in the yield map that I have ‘pixels’ that are clear ‘this is what the yield was at this spot’ as I pass through those zones of high and low nitrogen.”
When seeding the trial strips, VanKoughnet suggested making each trial replicate a bit wider than a clear round with the combine header.
“My preference is an up and back. Some people will just go one direction, but then you’ve got to have a wagon at both ends of the field. I’ll do a round Ñ up and back Ñ in treatment one, then I’ll have a little scrap between one and two, then do a round up and down in two and a round up and down in three. Then I’ll replicate that three or four times. Then I’ve got 10 or 15 foot (three or 4.5 metre) scraps that I’ll pick up later.”
He said his preference is to keep those strips narrow. “As you move wider, you move across more variations of soil type. The tighter they are, the tighter the data.”
When travelling across zones dealing with specific treatments, VanKoughnet wants eight to 12 yield monitor observations in each zone. He said planning the size of the zone involves working backward: how many observations does the monitor take per second; how fast are you travelling; and how many metres of buffer do you want to leave that you don’t count.
“Make those treatments wide enough that you have confidence you’ve captured enough data points in the treated, then through a buffer, then clear points in the untreated, through the buffer and so on.”
Usually 55 to 75 metres provides enough room to do that. VanKoughnet recommended not slowing down when testing these zones in an effort to capture more data points in each zone.
“Yield monitors work best running at capacity. If that’s where you’ve calibrated them, at operating speed, you don’t want to mess with that. Everything threshes better at capacity.”
In the secondary direction, VanKoughnet said producers are limited to treated and untreated. He generally does fertility trials across the combine direction.
“One of the reasons is when I come into that next year, if I want to do another trial on that field, the remnants of that extra nitrogen affect all of my other trials. If you put an extra 50 pounds of nitrogen on some strips, it might be three years before that field equals itself out,” he said.
As a matter of protocol on his farm, he always does the fertility strips at right angles. “Then it never screws me up.”
When he’s done harvest and has his yield maps, the next step is to analyze the data. With a well-designed trial, the analysis can be fairly straightforward.
“In mapping software, I can block those regions where the high level of nitrogen was, leaving a buffer zone on both sides, then ask my software to tell me what’s the average yield for that block. Then I can block on both sides of it and say, ‘what was the difference in the nitrogen strip versus the blocks on both sides of it?’ Then I can even go down into the microblocks and say, ‘I got a three bushel response in a high seeding rate but I didn’t get any response in a low seeding rate.’ I can block those individually.”
VanKoughnet emphasized the importance of thinking the design through and keeping objectives simple for the first few trials.
“I always look at what I’m struggling with in making my cropping decisions and say, ‘what is it I’d like to know more about? Is it nitrogen rate, seeding rate, fungicide use or seed treatment? What is that bit of information that I don’t have as high a level of confidence in that I need, even though I’ve got to make a decision this spring? What are my top two or three?’ Then I make sure somewhere on my farm I have a replicated trial so that at this time next year I can make that decision with more confidence.”
He suggested laying out those plots somewhere on the farm in a way that isn’t going to encumber the farm’s commercial operation too much. “Then make sure you bring that to harvest and have a good look at it next November and say, ‘what do I know from that, that I didn’t know before?’ “
VanKoughnet cautioned producers not to over-analyze or jump to conclusions based on one year’s observation. However, he said it’s amazing what trials have shown him Ñ that something was bigger than he thought it was or that there was no effect at all.
“It didn’t mean that I radically changed what I did next year, but I moved myself on the scale to say, ‘I’m going to watch that a heck of a lot closer,’ ” he said.
“I’ve had things where I got delayed a few hours seeding with a little shower and it changed the seed bed marginally. But it was an eight bu. difference. You never would have seen that until you picked that up with hard weights and a yield monitor.
“Eight bu. of canola Ñ that’s my input costs that I would have missed had I not followed that observation to completion and tested whether that made any difference. So now, if I have a perfect day to sow canola, I’d clean the drill out, leave wheat, go sow canola and come back to wheat later, because I’ve never had as staggering of a yield response to an average seed bed in wheat as I have in canola.”
VanKoughnet typically tests varieties and conducts fungicide trials, such as timings and product splits. As well, he might add extra nitrogen, sulfur or potash at right angles.
“The headland at the end is the normal rate, then a strip, then normal and another strip, then normal and another strip, then the headland at the other end. I only have treated and untreated, but I have three blocks equally spaced.”
VanKoughnet said trials done on the farm using the farmer’s production methods are the most relevant.
“The best agronomist you can find probably can’t find anything less than a 10 percent yield difference in a field,” he said.
“A well adjusted yield monitor, I can get within one percent. A two percent difference makes a big difference to my cash flow and income. If we’re looking for nickels, at 10 percent we’re still in dollars.”
He said there are big swings in net income on a 10 percent yield difference.
“If we can start finding the ones and twos in a meaningful way, those are the things that buy my holidays.”
Dan Gauthier farms near Donnelly, Alta., and has been working with precision farming equipment since the late 1990s. He’s planning to do a number of trials on his farm this year, using his combine yield monitor to track results.
“You have to have your mind wrapped around what you’re doing when you first start,” he said.
“We weren’t quite there last year, but this year we’re ready for it: how to make it work and do it.”
In 2005, he plans to conduct fertility, seeding rate and fungicide treatment trials.
“We fertilize when we’re seeding. Everything is going to be east-west with the fertility and seeding rate. We’ll change the seeding rate and fertility as we go. I have everything set up on electronic controls in the cab, so it’s easy to switch.”
Gauthier eventually plans to install a variable rate controller on his seed and fertilizer metering systems.
“The seed one, we’re in the middle of trying to install that and it’s not working well. We’ll do that one manually, but have the rates figured out before we go in the field, so it’s a quick adjustment.”
Fungicide treatments will run north-south, over top of the east-west seed rate and fertilizer rate trials.
He plans to do it on four different quarters with canola and oats.
“There’ll probably be quite a few replications of fertility levels: 50, 60, 70, 80, 90 and 100 (lb. of nitrogen) for both oats and canola. Then the seeding rates will run in half-lb. increments, from four to eight,” he said.
“In oats, the seeding rate will go from 22 live plants per sq. foot up to 36. It all depends on seed source.”
In the canola, he’s going to try different fungicide and water rates.
“We haven’t used fungicides much in the past, so we want to know if there’s really a payback. On the canola, we’re also going to be doing calcium trials for sclerotinia control Ñ a spray on foliar application,” Gauthier said.
“With fungicides on the oats, around here most guys say it doesn’t do anything, so this will be a trial to find out whether it does or not.”


