U.S. crop futures fell hard on Thursday from the bearish USDA report and improving Midwest weather.
Canola futures also fell, but not as hard, with November canola closing down $11.50 or 2.2 percent at $502.50 per tonne.
The canola crop still faces a forecast of mostly dry and warm weather over the next three days before more seasonal weather takes over next week. The Canadian dollar was little changed today after a sharp rally on Wednesday when the Bank of Canada raised interest rates.
SASKATCHEWAN CROP CONDITION
The Saskatchewan Agriculture crop report said 57 percent of the province’s canola crop was in good-to-excellent condition, down from 60 percent on June 26.
The five year (2012-16) average for early July is 70.2 percent, ranging from 45 percent in 2015 to 90 percent in 2016.
Read Also

New Quebec ag minister named in shuffle
Farmers in Quebec get a new representative at the provincial cabinet table as Premier Francois Legault names Donald Martel the new minister of agriculture, replacing Andre Lamontagne.
The spring wheat crop was 68 percent good to excellent, down two percentage points from June 26. Last year at this time it was 92 percent.
Durum was only 43 percent good to excellent, down from 49 percent June 26 and down from 93 percent last year.
US MARKETS
Kansas winter wheat led the way down with the December contract down five percent
November soybeans and December Chicago wheat were both down about 4.5 percent. December corn fell almost four percent.
Minneapolis spring wheat was down about 3.7 percent.
The U.S. Department of Agriculture monthly supply and demand report on Wednesday did not trim American corn and soybean production outlooks as some traders had expected. It lowered its spring wheat outlook to account for the Northern Plains drought, but not as much as traders expected and it raised its expectation of the winter wheat crop.
It pegged all wheat at 47.86 million tonnes, down from 49.64 last month and down from 62.86 million last year,
Trimming of the monthly wheat crop production outlooks in the U.S., Australia and Europe were mostly offset by a three million tonne increase in Russia’s wheat crop outlook.
US WEATHER
Midwest weather is not as hot and dry as was expected last week and that also pressured crop futures. Corn pollinated in July and so weather is critically important at this time.
Traders sold, taking profits from the sharp rally last week.
CHINA BUYS US SOYBEANS
A delegation of commodity importers from China, the world’s top soybean buyer, signed agreements on Thursday to buy 12.53 million tonnes of the U.S. crop in the second-largest deal between the two countries, the U.S. Soybean Export Council said.
Traders and analysts said the agreements provided little insight for the market, as final prices and shipment dates were not specified.
“They are meaningless,” Charlie Sernatinger, global head of grain futures at ED&F Man Capital told Reuters. “It is window dressing.”
OUTSIDE MARKETS
Light crude oil nearby futures in New York were up 59 cents US$46.08 per barrel.
In the afternoon, the Canadian dollar was trading around US78.57 cents, up from 78.49 cents the previous trading day. The U.S. dollar was C$1.2728.
The Toronto Stock Exchange’s S&P/TSX composite index ended down 8.99 points, or 0.06 percent, at 15,135.00.
The Dow Jones Industrial Average closed up 20.95 points, or 0.1 percent, to 21,553.09. The S&P 500 gained 4.58 points, or 0.19 percent, to 2,447.83 and the Nasdaq Composite rose 13.27 points, or 0.21 percent, to 6,274.44.
Winnipeg ICE Futures Canada dollars per tonne
Canola Nov 2017 502.50 -11.50 -2.24%
Canola Jan 2018 506.40 -11.10 -2.14%
Canola Mar 2018 510.00 -10.30 -1.98%
Canola May 2018 509.80 -10.70 -2.06%
Canola Jul 2018 510.20 -10.90 -2.09%
Milling Wheat Oct 2017 290.00 -15.00 -4.92%
Milling Wheat Dec 2017 299.00 -14.00 -4.47%
Milling Wheat Mar 2018 305.00 -12.00 -3.79%
Durum Wheat Oct 2017 279.00 +5.00 +1.82%
Durum Wheat Dec 2017 281.00 +6.00 +2.18%
Durum Wheat Mar 2018 283.00 +6.00 +2.17%
Barley Oct 2017 140.00 unch 0.00%
Barley Dec 2017 140.00 unch 0.00%
Barley Mar 2018 140.00 unch 0.00%
American crop prices in cents US/bushel, soybean meal in $US/short ton, soy oil in cents US/pound
Chicago
Soybeans Jul 2017 972.50 -44.25 -4.35%
Soybeans Aug 2017 975.50 -44.75 -4.39%
Soybeans Sep 2017 978.75 -46.00 -4.49%
Soybeans Nov 2017 987.50 -46.25 -4.47%
Soybeans Jan 2018 996.00 -45.50 -4.37%
Soybeans Mar 2018 999.50 -43.25 -4.15%
Soybean Meal Jul 2017 316.80 -17.60 -5.26%
Soybean Meal Aug 2017 317.90 -18.40 -5.47%
Soybean Meal Sep 2017 319.90 -18.10 -5.36%
Soybean Oil Jul 2017 33.01 -0.42 -1.26%
Soybean Oil Aug 2017 33.07 -0.39 -1.17%
Soybean Oil Sep 2017 33.19 -0.39 -1.16%
Corn Jul 2017 361.00 -15.25 -4.05%
Corn Sep 2017 369.75 -14.75 -3.84%
Corn Dec 2017 383.00 -15.00 -3.77%
Corn Mar 2018 393.50 -14.25 -3.49%
Corn May 2018 398.75 -14.00 -3.39%
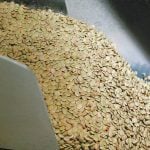
Oats Jul 2017 294.50 -5.75 -1.92%
Oats Sep 2017 275.75 -6.25 -2.22%
Oats Dec 2017 278.75 -5.50 -1.93%
Oats Mar 2018 277.00 -5.75 -2.03%
Oats May 2018 276.00 -7.50 -2.65%
Wheat Jul 2017 495.50 -27.00 -5.17%
Wheat Sep 2017 511.75 -22.75 -4.26%
Wheat Dec 2017 535.00 -22.75 -4.08%
Wheat Mar 2018 554.00 -22.50 -3.90%
Wheat May 2018 565.00 -20.75 -3.54%
Minneapolis
Spring Wheat Jul 2017 745.75 -36.25 -4.64%
Spring Wheat Sep 2017 749.50 -33.25 -4.25%
Spring Wheat Dec 2017 753.00 -28.75 -3.68%
Spring Wheat Mar 2018 747.00 -23.50 -3.05%
Spring Wheat May 2018 737.75 -18.75 -2.48%
Kansas City
Hard Red Wheat Jul 2017 499.75 -28.25 -5.35%
Hard Red Wheat Sep 2017 515.50 -25.00 -4.63%
Hard Red Wheat Dec 2017 542.00 -25.00 -4.41%
Hard Red Wheat Mar 2018 558.25 -25.25 -4.33%
Hard Red Wheat May 2018 570.00 -26.50 -4.44%
Chicago livestock futures in US¢/pound (rounded to two decimal places)
Live Cattle (P) Aug 2017 117.42 -0.03 -0.03%
Live Cattle (P) Oct 2017 117.82 +0.42 +0.36%
Live Cattle (P) Dec 2017 118.22 +0.30 +0.25%
Feeder Cattle (P) Aug 2017 153.03 +1.77 +1.17%
Feeder Cattle (P) Sep 2017 152.98 +1.80 +1.19%
Feeder Cattle (P) Oct 2017 151.50 +2.00 +1.34%
Lean Hogs (P) Jul 2017 92.75 +0.24 +0.26%
Lean Hogs (P) Aug 2017 82.52 -0.17 -0.21%
Lean Hogs (P) Oct 2017 69.32 +0.07 +0.10%