Crop futures had little to trade on Tuesday other than a weaker U.S. dollar.
The loonie gained about a half cent as the U.S. dollar weakened against most other currencies.
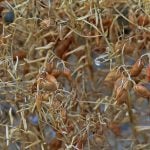
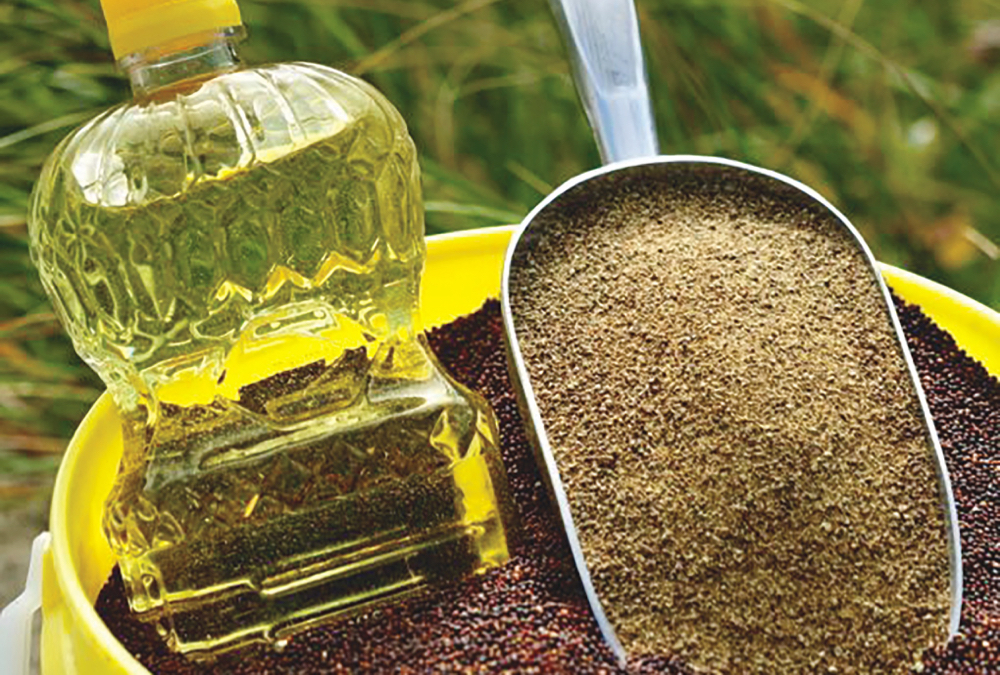
The stronger loonie weighed down March canola, which fell $3.40 a tonne to $507.50.
But U.S. crop markets perked up a little thanks to the weaker greenback.
Wheat often seems to be the most affected by currency changes and the Chicago market gained the most among grains, climbing 1.6 percent in the March contract. Kansas also edged higher, but Minneapolis was slightly lower.
Read Also
Survey says Canadians support canola producers over EV tariffs
The majority of Canadians are in favour of lowering tariffs on Chinese electric vehicles if it would help improve market access for Canadian canola according to new data from the Angus Reid Institute.
Corn and the soy complex were up a tiny amount.
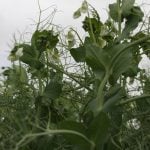
Agriculture Canada issued its first forecast for the 2017-18 crop year. It expects fewer acres seeded to wheat, durum and barley and more to canola, soybeans flax and oats.
It expects a three percent increase in canola acres, but penciled in a trend line yield that is a little lower than the 2016 average. The result is a forecast production of 8.5 million tonnes compared to the official estimate of 8.424 million tonnes for 2016.
CLICK HERE TO SEE A STORY ON THE AGRICULTURE CANADA FORECAST
The American dollar fell following comments from President Trump as well as it top trade advisor Peter Navarro that indicate they are trying to “talk down” the U.S. buck and that they think other countries are unfairly weakening their currencies.
The market had been assuming that the U.S. dollar would be strong this year as the U.S. Federal Reserve plans to increase interest rates more than once. But that assumption is now questioned as the new administration keeps talking about an overpriced U.S. dollar.
The weather continues favourable for South American crops. Commodity funds have built their biggest net long position in soybean futures since mid-July.
The USDA state wheat condition report issued Monday showed rain in January halted the decline in the health of the crop, which is mostly dormant.
Kansas was 20 percent poor to very poor, 36 percent fair and 44 percent good to excellent.
At the end of the previous month it was 19 percent poor to very poor, 37 percent fair and 44 percent good to excellent.
In Oklahoma wheat was unchanged from the previous month at 17 percent poor to very poor, 50 percent fair and 33 percent good to very good.
Light crude oil nearby futures in New York were up 18 cents to US$52.81 per barrel.
The Canadian dollar at noon was US76.75 cents, up from 76.38 cents the previous trading day. The U.S. dollar at noon was C$1.3030.
The Toronto Stock Exchange’s S&P/TSX composite index closed down 19.16 points, or 0.12 percent, at 15,385.96.
The Dow Jones Industrial Average fell 106.9 points, or 0.54 percent, to 19,864.23, the S&P 500 lost 2.02 points, or 0.09 percent, to 2,278.88 and the Nasdaq Composite added 1.07 points, or 0.02 percent, to 5,614.79.
Winnipeg ICE Futures Canada dollars per tonne
Canola Mar 2017 507.50 -3.40 -0.67%
Canola May 2017 514.10 -3.60 -0.70%
Canola Jul 2017 517.60 -3.50 -0.67%
Canola Dec 2017 496.00 -3.00 -0.60%
Canola Jan 2018 500.50 -2.60 -0.52%
Milling Wheat Mar 2017 231.00 -1.00 -0.43%
Milling Wheat May 2017 235.00 -1.00 -0.42%
Milling Wheat Jul 2017 237.00 -1.00 -0.42%
Durum Wheat Mar 2017 296.00 -2.00 -0.67%
Durum Wheat May 2017 298.00 -3.00 -1.00%
Durum Wheat Jul 2017 298.00 -9.00 -2.93%
Barley Mar 2017 135.00 unch 0.00%
Barley May 2017 137.00 unch 0.00%
Barley Jul 2017 138.00 unch 0.00%
American crop prices in cents US/bushel, soybean meal in $US/short ton, soy oil in cents US/pound
Chicago
Soybeans Mar 2017 1024.50 +1.75 +0.17%
Soybeans May 2017 1034.25 +1.50 +0.15%
Soybeans Jul 2017 1042.00 +1.50 +0.14%
Soybeans Aug 2017 1039.50 +1.00 +0.10%
Soybeans Sep 2017 1019.50 -1.00 -0.10%
Soybeans Nov 2017 1001.00 -3.00 -0.30%
Soybean Meal Mar 2017 334.60 +0.20 +0.06%
Soybean Meal May 2017 337.90 +0.40 +0.12%
Soybean Meal Jul 2017 340.10 +0.60 +0.18%
Soybean Oil Mar 2017 33.85 +0.24 +0.71%
Soybean Oil May 2017 34.14 +0.24 +0.71%
Soybean Oil Jul 2017 34.40 +0.24 +0.70%
Corn Mar 2017 359.75 +2.00 +0.56%
Corn May 2017 367.00 +2.00 +0.55%
Corn Jul 2017 373.75 +1.75 +0.47%
Corn Sep 2017 380.50 +1.75 +0.46%
Corn Dec 2017 387.25 +1.75 +0.45%
Oats Mar 2017 244.25 +0.50 +0.21%
Oats May 2017 238.75 +0.50 +0.21%
Oats Jul 2017 236.00 +0.25 +0.11%
Oats Sep 2017 233.25 unch 0.00%
Oats Dec 2017 225.75 -0.75 -0.33%
Wheat Mar 2017 420.75 +6.75 +1.63%
Wheat May 2017 433.50 +5.25 +1.23%
Wheat Jul 2017 447.25 +4.75 +1.07%
Wheat Sep 2017 462.25 +4.00 +0.87%
Wheat Dec 2017 479.75 +3.00 +0.63%
Minneapolis
Spring Wheat Mar 2017 548.50 -2.75 -0.50%
Spring Wheat May 2017 547.50 -2.00 -0.36%
Spring Wheat Jul 2017 551.00 -1.50 -0.27%
Spring Wheat Sep 2017 554.50 -0.50 -0.09%
Spring Wheat Dec 2017 561.00 unch 0.00%
Kansas City
Hard Red Wheat Mar 2017 429.50 +3.75 +0.88%
Hard Red Wheat May 2017 442.25 +4.00 +0.91%
Hard Red Wheat Jul 2017 454.25 +4.00 +0.89%
Hard Red Wheat Sep 2017 468.75 +4.00 +0.86%
Hard Red Wheat Dec 2017 490.00 +4.75 +0.98%
Chicago livestock futures in US¢/pound (rounded to two decimal places)
Live Cattle (P) Feb 2017 115.60 -0.58 -0.50%
Live Cattle (P) Apr 2017 114.18 -0.64 -0.56%
Live Cattle (P) Jun 2017 104.20 -0.35 -0.33%
Feeder Cattle (P) Mar 2017 122.77 -1.13 -0.91%
Feeder Cattle (P) Apr 2017 122.42 -1.13 -0.91%
Feeder Cattle (P) May 2017 121.32 -0.83 -0.68%
Lean Hogs (P) Feb 2017 69.08 +1.98 +2.95%
Lean Hogs (P) Apr 2017 69.25 +1.03 +1.51%
Lean Hogs (P) May 2017 73.98 +1.01 +1.38%