Canola fell Monday as soybeans, soybean meal and soybean oil all fell.
That reflected weakness almost everywhere, as all crop futures fell and most commodities weakened.
It was also a poor day in the equity markets, with stocks selling off on a risk-off day.
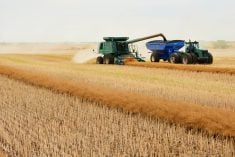
Spring wheat fell alongside the winter wheat contracts.
Only metals rose among the commodity futures.
Gold rose slightly, as expected on a day in which investors seemed to want to reduce the risk of their positions.
Read Also
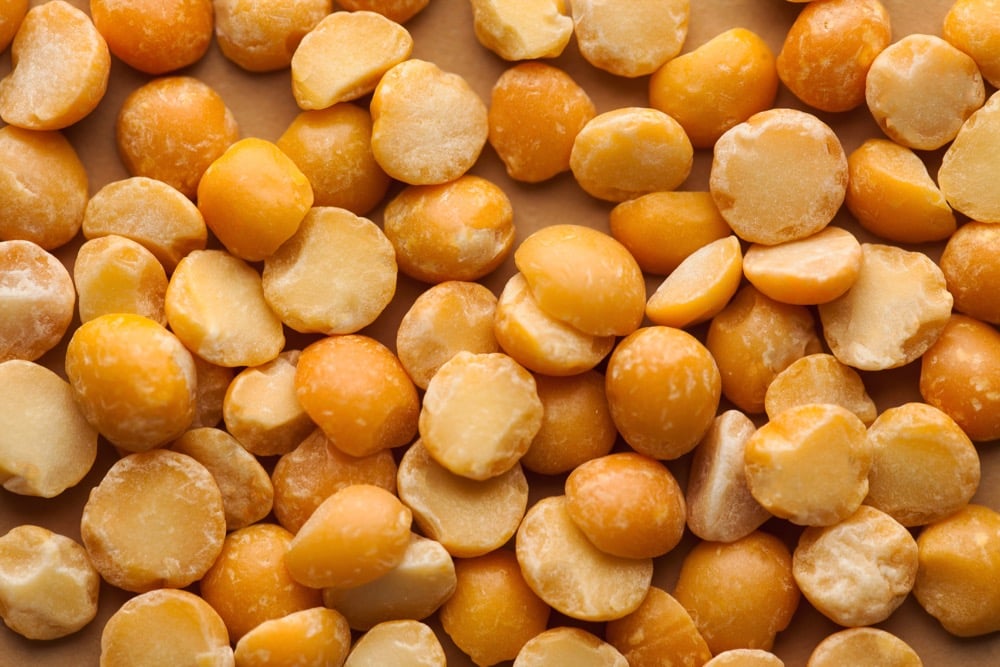
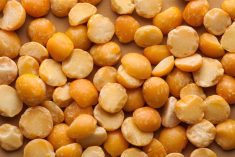
Pulse Weekly: Talk arises of India ending duty-free period
With harvest underway across the Canadian Prairies rumblings has been felt from the other side of the world, specifically in regards yellow peas. There have been recent media reports stating the Indian government is under growing domestic pressure to end its duty-free period on yellow pea imports.
Light crude oil nearby futures in New York were down 54 cents to US$52.63 per barrel.
The Canadian dollar at noon was US76.38 cents, up from 76.29 cents the previous trading day. The U.S. dollar at noon was C$1.3093.
Winnipeg ICE Futures Canada dollars per tonne
Canola Mar 2017 510.90 -7.00 -1.35%
Canola May 2017 517.70 -6.70 -1.28%
Canola Jul 2017 521.10 -6.50 -1.23%
Canola Nov 2017 499.00 -6.10 -1.21%
Canola Jan 2018 503.10 -6.30 -1.24%
Milling Wheat Mar 2017 232.00 -2.00 -0.85%
Milling Wheat May 2017 236.00 -3.00 -1.26%
Durum Wheat Mar 2017 298.00 -4.00 -1.32%
Durum Wheat May 2017 301.00 -4.00 -1.31%
Durum Wheat Jul 2017 307.00 -7.00 -2.23%
Barley Mar 2017 135.00 -4.00 -2.88%
Barley May 2017 137.00 -4.00 -2.84%
Barley Jul 2017 138.00 -4.00 -2.82%
American crop prices in cents US/bushel, soybean meal in $US/short ton, soy oil in cents US/pound
Chicago
Soybeans Mar 2017 1022.75 -26.50 -2.53%
Soybeans May 2017 1032.75 -26.00 -2.46%
Soybeans Jul 2017 1040.50 -25.25 -2.37%
Soybeans Aug 2017 1038.50 -24.75 -2.33%
Soybeans Nov 2017 1004.00 -21.75 -2.12%
Soybean Meal Mar 2017 334.40 -8.40 -2.45%
Soybean Meal May 2017 337.50 -8.30 -2.40%
Soybean Meal Jul 2017 339.50 -8.50 -2.44%
Soybean Oil Mar 2017 33.61 -0.73 -2.13%
Soybean Oil May 2017 33.90 -0.70 -2.02%
Soybean Oil Jul 2017 34.16 -0.68 -1.95%
Corn Mar 2017 357.75 -5.25 -1.45%
Corn May 2017 365.00 -5.25 -1.42%
Corn Jul 2017 372.00 -4.75 -1.26%
Corn Sep 2017 378.75 -4.25 -1.11%
Oats Mar 2017 243.75 -9.50 -3.75%
Oats May 2017 238.25 -7.75 -3.15%
Oats Jul 2017 235.75 -4.25 -1.77%
Oats Sep 2017 233.25 -6.00 -2.51%
Oats Dec 2017 226.50 -3.50 -1.52%
Wheat Mar 2017 414.00 -6.50 -1.55%
Wheat May 2017 428.25 -6.50 -1.50%
Wheat Jul 2017 442.50 -7.00 -1.56%
Wheat Sep 2017 458.25 -6.00 -1.29%
Wheat Dec 2017 476.75 -5.25 -1.09%
Minneapolis
Spring Wheat Mar 2017 551.25 -8.25 -1.47%
Spring Wheat May 2017 549.50 -6.50 -1.17%
Spring Wheat Sep 2017 555.00 -2.25 -0.40%
Spring Wheat Dec 2017 561.00 -1.50 -0.27%
Kansas City
Hard Red Wheat Mar 2017 425.75 -9.25 -2.13%
Hard Red Wheat May 2017 438.25 -8.75 -1.96%
Hard Red Wheat Jul 2017 450.25 -8.75 -1.91%
Hard Red Wheat Sep 2017 464.75 -8.75 -1.85%
Hard Red Wheat Dec 2017 485.25 -8.75 -1.77%
Chicago livestock futures in US¢/pound (rounded to two decimal places)
Live Cattle (P) Feb 2017 116.18 -1.87 -1.58%
Live Cattle (P) Jun 2017 104.55 -2.07 -1.94%
Feeder Cattle (P) Mar 2017 123.90 -3.28 -2.58%
Feeder Cattle (P) Apr 2017 123.55 -2.97 -2.35%
Feeder Cattle (P) May 2017 122.15 -2.70 -2.16%
Lean Hogs (P) Feb 2017 67.10 +0.30 +0.45%
Lean Hogs (P) Apr 2017 68.22 -0.16 -0.23%
Lean Hogs (P) May 2017 72.98 +0.16 +0.22%