Canola fell along with soybeans on Tuesday, the first trading day of the new year.
Good moisture and growing conditions in much of South America have weighed down oilseeds over the past week.
Argentina was dry before Christmas but most areas have received strong rains since. Only southern growing regions remain dry.
Corn edged higher but wheat futures were a little lower.
Most-traded March canola fell $3.90 to remain just above the psychologically important $500 a tonne level. At one point today the contract did drop just below $500 but then rallied back.
Read Also
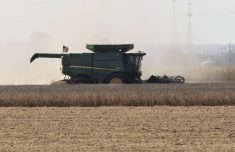
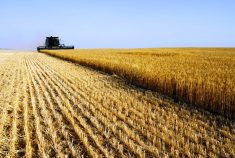
Alberta harvest wrapping up: report
Harvest operations advanced to 96 per cent complete in Alberta as of Oct. 7, with only a few late-seeded cereal and canola fields remaining, according to the latest provincial crop report.
Since Dec. 23, the last trading day before Christmas, to today, March canola has fallen $13.30 a tonne.
Soybeans have also been pressured, but they did rally and then fall back last week, whereas canola has mostly steadily fallen.
Soy oil has also been on a generally negative footing since before Christmas.
A somewhat firmer loonie in the last few days is also weighing on canola futures.
Chicago corn firmed on technical buying and expectations that commodity index funds will buy corn as they make annual adjustments to their portfolios for 2017, Reuters reported.
The managers of both the S&P GSCI and the Bloomberg Commodity Index last autumn announced plans to raise the share of corn and wheat in their indexes for 2017, and the funds typically make those adjustments in January.
WHEAT
Wheat turned lower in technical moves, retreating from early advances, Reuters said. But worries about dry conditions in Kansas and Oklahoma, the top U.S. winter wheat states, underpinned values.
Seventy percent of Oklahoma is reported as having short to very short soil moisture conditions.
The winter wheat crop in the state is 25 percent poor to very poor, 50 percent fair and 25 percent good.
In Kansas, the biggest winter wheat state, topsoil moisture rated 23 percent very short, 34 short, 42 adequate, and one percent surplus.
Subsoil moisture rated 16 percent very short, 28 short, 55 adequate, and one percent surplus.
Winter wheat condition rated five percent very poor, 14 poor, 37 fair, 42 good, and two percent excellent.
Light crude oil nearby futures in New York were down $1.39 to US$52.33 per barrel.
The Canadian dollar at noon was US74.42 cents, little changed from 74.48 cents the previous trading day. The U.S. dollar at noon was C$1.3438.
The Toronto Stock Exchange’s S&P/TSX composite index rose 115.44 points, or 0.76 percent, closing at 15,403.03.
It earlier touched 15,450.27, its highest since April 27, 2015.
The Dow Jones Industrial Average rose 115.63 points, or 0.59 percent, to 19,878.23, the S&P 500 gained 18.8 points, or 0.84 percent, to 2,257.63 and the Nasdaq Composite added 45.97 points, or 0.85 percent, to 5,429.08.
Winnipeg ICE Futures Canada dollars per tonne
Canola Mar 2017 500.10 -3.90 -0.77%
Canola May 2017 506.80 -4.10 -0.80%
Canola Jul 2017 511.30 -4.30 -0.83%
Canola Nov 2017 490.60 -1.20 -0.24%
Canola Jan 2018 491.80 -1.60 -0.32%
Milling Wheat Mar 2017 235.00 -2.00 -0.84%
Milling Wheat May 2017 238.00 -1.00 -0.42%
Milling Wheat Jul 2017 239.00 -2.00 -0.83%
Durum Wheat Mar 2017 319.00 unch 0.00%
Durum Wheat May 2017 322.00 unch 0.00%
Durum Wheat Jul 2017 326.00 -1.00 -0.31%
Barley Mar 2017 142.00 unch 0.00%
Barley May 2017 144.00 unch 0.00%
Barley Jul 2017 145.00 unch 0.00%
American crop prices in cents US/bushel, soybean meal in $US/short ton, soy oil in cents US/pound
Chicago
Soybeans Jan 2017 986.75 -10.25 -1.03%
Soybeans Mar 2017 995.00 -10.00 -1.00%
Soybeans May 2017 1003.50 -10.00 -0.99%
Soybeans Jul 2017 1010.25 -10.00 -0.98%
Soybeans Aug 2017 1009.50 -8.25 -0.81%
Soybeans Sep 2017 995.00 -7.50 -0.75%
Soybean Meal Jan 2017 308.30 -5.00 -1.60%
Soybean Meal Mar 2017 312.10 -4.60 -1.45%
Soybean Meal May 2017 315.00 -4.30 -1.35%
Soybean Oil Jan 2017 34.57 +0.11 +0.32%
Soybean Oil Mar 2017 34.81 +0.12 +0.35%
Soybean Oil May 2017 35.05 +0.12 +0.34%
Corn Mar 2017 355.75 +4.75 +1.35%
Corn May 2017 361.50 +4.50 +1.26%
Corn Jul 2017 368.25 +4.75 +1.31%
Corn Sep 2017 375.00 +4.00 +1.08%
Corn Dec 2017 383.50 +4.00 +1.05%
Oats Mar 2017 235.50 +7.00 +3.06%
Oats May 2017 235.00 +8.25 +3.64%
Oats Jul 2017 236.25 +8.00 +3.50%
Oats Sep 2017 236.25 unch 0.00%
Oats Dec 2017 238.00 +4.75 +2.04%
Wheat Mar 2017 406.50 -2.25 -0.55%
Wheat May 2017 418.00 -3.00 -0.71%
Wheat Jul 2017 431.50 -3.25 -0.75%
Wheat Sep 2017 445.00 -3.25 -0.73%
Wheat Dec 2017 461.75 -3.00 -0.65%
Minneapolis
Spring Wheat Mar 2017 537.50 -0.50 -0.09%
Spring Wheat May 2017 534.25 unch 0.00%
Spring Wheat Jul 2017 536.75 -0.25 -0.05%
Spring Wheat Sep 2017 542.25 +1.00 +0.18%
Spring Wheat Dec 2017 551.00 +0.50 +0.09%
Kansas City
Hard Red Wheat Mar 2017 414.00 -4.75 -1.13%
Hard Red Wheat May 2017 425.50 -4.50 -1.05%
Hard Red Wheat Jul 2017 436.50 -4.50 -1.02%
Hard Red Wheat Sep 2017 450.50 -1.50 -0.33%
Hard Red Wheat Dec 2017 469.00 -2.50 -0.53%
Chicago livestock futures in US¢/pound (rounded to two decimal places)
Live Cattle (P) Feb 2017 114.88 -1.10 -0.95%
Live Cattle (P) Apr 2017 113.95 -0.73 -0.64%
Live Cattle (P) Jun 2017 104.15 -0.87 -0.83%
Feeder Cattle (P) Jan 2017 130.20 -0.58 -0.44%
Feeder Cattle (P) Mar 2017 125.02 -0.40 -0.32%
Feeder Cattle (P) Apr 2017 124.78 -0.22 -0.18%
Lean Hogs (P) Feb 2017 63.50 -2.30 -3.50%
Lean Hogs (P) Apr 2017 66.90 -0.90 -1.33%
Lean Hogs (P) May 2017 71.70 -1.20 -1.65%