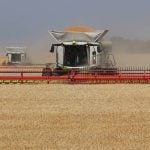
WINNIPEG, Manitoba, Nov 21 (Reuters) – ICE Canada canola futures rose on Monday to a nearly three-week high, pulled up by strength in U.S. soybean and Malaysian palm oil markets.
* Farmer selling into the cash pipeline, as late-harvested supplies come in, limited canola’s advances, a trader said.
* January canola added $6.70 at $521.20 per tonne.
* January-March canola spread traded 3,068 times.
* Chicago January soybeans gained on strength in Asian oilseeds and crude oil.
* NYSE Liffe February rapeseed and Malaysian January crude palm oil rose.
Read Also
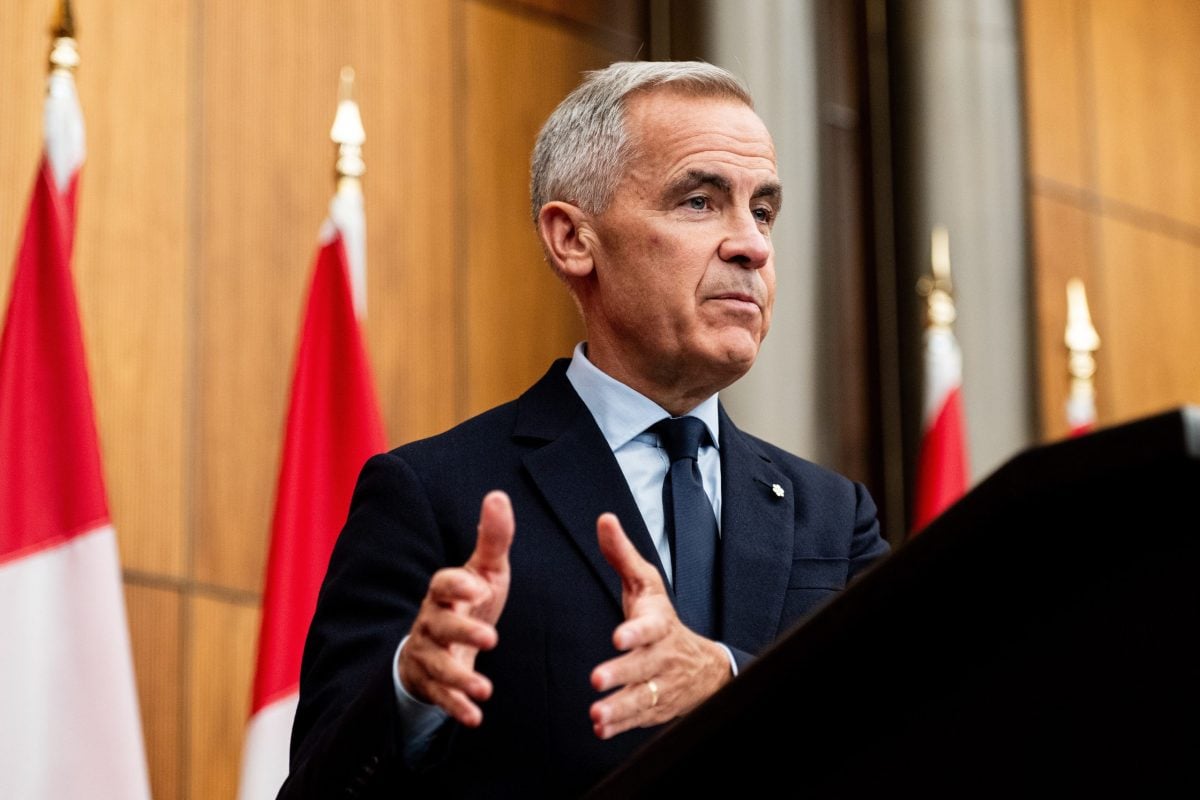
Mark Carney lifted some tariffs against the U.S. Was that a wise tactical move, or a bad blunder?
Though some might call it weakness, Prime Minister Mark Carney’s move to lift the retaliatory tariffs on U.S. goods covered under CUSMA while retaining tariffs on auto, steel and aluminum, is arguably a wise strategy says economist Nargess Kayhani.
* The Canadian dollar was trading at $1.3435 to the U.S. dollar, or 74.43 U.S. cents at 12:52 p.m. CST (1852 GMT), higher than Friday’s close of $1.3513, or 74 U.S. cents.
Light crude oil nearby futures in New York were up $1.80 to US$47.49 per barrel.
The Canadian dollar at noon was US74.42 cents, up from 73.97 cents the previous trading day. The U.S. dollar at noon was C$1.3437.
Winnipeg ICE Futures Canada dollars per tonne
Canola Jan 2017 521.20 +6.70 +1.30%
Canola Mar 2017 527.30 +6.70 +1.29%
Canola May 2017 529.80 +5.80 +1.11%
Canola Jul 2017 529.80 +5.20 +0.99%
Canola Nov 2017 505.30 +1.10 +0.22%
Milling Wheat Dec 2016 232.00 +1.00 +0.43%
Milling Wheat Mar 2017 235.00 unch 0.00%
Milling Wheat May 2017 237.00 unch 0.00%
Durum Wheat Dec 2016 326.00 -3.00 -0.91%
Durum Wheat Mar 2017 336.00 -4.00 -1.18%
Durum Wheat May 2017 339.00 -4.00 -1.17%
Barley Dec 2016 132.50 unch 0.00%
Barley Mar 2017 134.50 unch 0.00%
American crop prices in cents US/bushel, soybean meal in $US/short ton, soy oil in cents US/pound
Chicago
Soybeans Jan 2017 1020.25 +25.25 +2.54%
Soybeans Mar 2017 1028.50 +24.75 +2.47%
Soybeans May 2017 1035.75 +24.00 +2.37%
Soybeans Jul 2017 1041.25 +23.25 +2.28%
Soybeans Aug 2017 1038.75 +24.00 +2.37%
Soybeans Sep 2017 1022.50 +18.25 +1.82%
Soybean Meal Dec 2016 319.70 +9.20 +2.96%
Soybean Meal Jan 2017 321.90 +9.10 +2.91%
Soybean Meal Mar 2017 324.20 +8.60 +2.72%
Soybean Oil Dec 2016 34.64 +0.48 +1.41%
Soybean Oil Jan 2017 34.93 +0.53 +1.54%
Soybean Oil Mar 2017 35.18 +0.50 +1.44%
Corn Dec 2016 349.75 +3.75 +1.08%
Corn Mar 2017 357.75 +4.00 +1.13%
Corn May 2017 364.25 +3.50 +0.97%
Corn Jul 2017 371.50 +3.50 +0.95%
Corn Sep 2017 378.00 +3.75 +1.00%
Oats Dec 2016 224.75 -7.50 -3.23%
Oats Mar 2017 229.00 -7.00 -2.97%
Oats May 2017 230.25 -8.00 -3.36%
Oats Jul 2017 231.25 -3.75 -1.60%
Oats Sep 2017 226.50 -8.25 -3.51%
Wheat Dec 2016 410.25 +3.25 +0.80%
Wheat Mar 2017 427.00 +2.75 +0.65%
Wheat May 2017 440.50 +2.00 +0.46%
Wheat Jul 2017 454.75 +2.25 +0.50%
Wheat Sep 2017 469.25 +1.50 +0.32%
Minneapolis
Spring Wheat Dec 2016 526.75 -1.75 -0.33%
Spring Wheat Mar 2017 523.75 -1.75 -0.33%
Spring Wheat May 2017 527.50 -2.25 -0.42%
Spring Wheat Jul 2017 532.50 -2.75 -0.51%
Spring Wheat Sep 2017 539.75 -2.50 -0.46%
Kansas City
Hard Red Wheat Dec 2016 414.50 +1.00 +0.24%
Hard Red Wheat Mar 2017 432.00 +1.25 +0.29%
Hard Red Wheat May 2017 444.00 +1.25 +0.28%
Hard Red Wheat Jul 2017 455.00 +1.00 +0.22%
Hard Red Wheat Sep 2017 469.25 +2.00 +0.43%
Chicago livestock futures in US¢/pound (rounded to two decimal places)
Live Cattle (P) Dec 2016 109.02 +0.72 +0.66%
Live Cattle (P) Feb 2017 109.58 +0.73 +0.67%
Live Cattle (P) Apr 2017 109.52 +0.52 +0.48%
Feeder Cattle (P) Jan 2017 124.18 -1.20 -0.96%
Feeder Cattle (P) Mar 2017 119.98 -1.12 -0.92%
Feeder Cattle (P) Apr 2017 119.58 -1.24 -1.03%
Lean Hogs (P) Dec 2016 49.78 +2.18 +4.58%
Lean Hogs (P) Feb 2017 56.38 +2.46 +4.56%
Lean Hogs (P) Apr 2017 62.62 +1.77 +2.91%