Canola futures closed down a little while soybean staged a small rally on Thursday.
Wheat and corn closed slightly lower.
Soybeans were supported by ideas that demand will remain strong and by short covering after a three day slide.
Click here to see this week’s crop market video
Wheat and corn dipped on the expectation of big crops. U.S. corn weekly export sales came in lower than expected.
Read Also
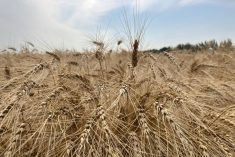
Australian crops to surpass 10-year averages
Australian farmers are forecast to grow slightly more canola and barley this year, while wheat production may dip, according to the latest estimates from the Australian Bureau of Agricultural and Resource Economics and Sciences (ABARES).
Consultancy Strategie Grains again cut its estimate of this year’s soft wheat production in the European Union to 136.5 million tonnes, down 1.4 million tonnes last month, and lowered the expected share of milling-quality wheat.
Manitoba could get some rain tonight but the rest of the Prairies look to enjoy mostly sunny weather into next week. Moisture could again enter the picture in the middle of next week.
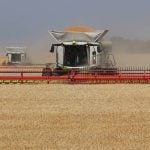
Harvest progress slowed in Saskatchewan this past week. to Sept. 12 The provincial agriculture department said 38 percent of the crop has been combined, up from 32 percent the week before.
Thirty-eight percent is swathed or ready to straight-cut, same as the week before.
The five-year (2011-15) average for this time of year is 44 per cent combined.
U.S. soy processors crushed 2.6 percent fewer beans in August than a year earlier and the pace fell below market expectations due to declines at plants in the Southwest, the National Oilseed Processors Association said on Thursday.
Crude oil rose on a pipeline outage in the U.S. and on short covering after weakness earlier this week.
The rally in Apple shares continued, fueled by strong iPhone 7 sales, helping to lift American stock indexes.
Also investors appear to be leaning toward the idea that the Federal Reserve will not increase interest rates at its meeting next week.
The Toronto Stock Exchange’s S&P/TSX composite index closed up 137.21 points, or 0.96 percent, at 14,503.67.
The Dow Jones industrial average jumped 0.99 percent to end the day at 18,212.48 points and the S&P 500 rallied 1.01 percent to 2,147.26.
The Nasdaq Composite climbed 1.47 percent to 5,249.69.
Light crude oil nearby futures in New York were up 33 cents to US$43.91 per barrel.
The Canadian dollar at noon was US76.07 cents, up from 75.82 cents the previous trading day. The U.S. dollar at noon was C$1.3146.
Winnipeg ICE Futures Canada dollars per tonne
Canola Nov 2016 455.70 -1.90 -0.42%
Canola Jan 2017 462.20 -1.90 -0.41%
Canola Mar 2017 466.40 -2.20 -0.47%
Canola May 2017 470.60 -2.20 -0.47%
Canola Jul 2017 473.30 -2.10 -0.44%
Milling Wheat Oct 2016 212.00 -1.00 -0.47%
Milling Wheat Dec 2016 215.00 unch 0.00%
Milling Wheat Mar 2017 219.00 unch 0.00%
Durum Wheat Oct 2016 266.00 +1.00 +0.38%
Durum Wheat Dec 2016 267.00 unch 0.00%
Durum Wheat Mar 2017 271.00 +1.00 +0.37%
Barley Oct 2016 135.00 -3.00 -2.17%
Barley Dec 2016 135.00 -3.00 -2.17%
Barley Mar 2017 137.00 -3.00 -2.14%
American crop prices in cents US/bushel, soybean meal in $US/short ton, soy oil in cents US/pound
Chicago
Soybeans Nov 2016 950.50 +7.75 +0.82%
Soybeans Jan 2017 955.75 +7.75 +0.82%
Soybeans Mar 2017 958.75 +7.25 +0.76%
Soybeans May 2017 964.50 +7.00 +0.73%
Soybeans Jul 2017 970.00 +6.75 +0.70%
Soybeans Aug 2017 967.00 +6.50 +0.68%
Soybean Meal Oct 2016 308.60 +1.50 +0.49%
Soybean Meal Dec 2016 307.20 +1.50 +0.49%
Soybean Meal Jan 2017 307.10 +1.50 +0.49%
Soybean Oil Oct 2016 32.04 +0.42 +1.33%
Soybean Oil Dec 2016 32.28 +0.42 +1.32%
Soybean Oil Jan 2017 32.51 +0.42 +1.31%
Corn Dec 2016 330.00 -1.75 -0.53%
Corn Mar 2017 340.25 -2.25 -0.66%
Corn May 2017 347.00 -3.00 -0.86%
Corn Jul 2017 354.00 -2.50 -0.70%
Corn Sep 2017 360.75 -2.50 -0.69%
Oats Dec 2016 173.00 -1.50 -0.86%
Oats Mar 2017 185.75 -1.50 -0.80%
Oats May 2017 191.00 -2.75 -1.42%
Oats Jul 2017 198.50 -2.25 -1.12%
Oats Sep 2017 198.50 -2.25 -1.12%
Wheat Dec 2016 399.50 -3.50 -0.87%
Wheat Mar 2017 422.25 -2.25 -0.53%
Wheat May 2017 437.00 -2.50 -0.57%
Wheat Jul 2017 448.25 -1.50 -0.33%
Wheat Sep 2017 464.00 -0.25 -0.05%
Minneapolis
Spring Wheat Dec 2016 491.25 -1.75 -0.35%
Spring Wheat Mar 2017 501.75 -1.75 -0.35%
Spring Wheat May 2017 510.75 -1.75 -0.34%
Spring Wheat Jul 2017 519.75 -1.75 -0.34%
Spring Wheat Sep 2017 529.75 -2.00 -0.38%
Kansas City
Hard Red Wheat Dec 2016 416.00 -2.25 -0.54%
Hard Red Wheat Mar 2017 432.00 -2.50 -0.58%
Hard Red Wheat May 2017 442.50 -2.50 -0.56%
Hard Red Wheat Jul 2017 453.00 -2.00 -0.44%
Hard Red Wheat Sep 2017 468.00 -2.00 -0.43%
Chicago livestock futures in US¢/pound (rounded to two decimal places)
Live Cattle (P) Oct 2016 106.95 +1.15 +1.09%
Live Cattle (P) Dec 2016 106.98 +0.61 +0.57%
Live Cattle (P) Feb 2017 107.20 +0.75 +0.70%
Feeder Cattle (P) Sep 2016 133.98 +1.30 +0.98%
Feeder Cattle (P) Oct 2016 131.70 +1.57 +1.21%
Feeder Cattle (P) Nov 2016 129.32 +1.19 +0.93%
Lean Hogs (P) Oct 2016 55.15 +0.23 +0.42%
Lean Hogs (P) Dec 2016 49.45 +0.35 +0.71%
Lean Hogs (P) Feb 2017 53.85 +0.58 +1.09%