
THE ICE Futures Canada canola market posted modest gains in the wake of Tuesday’s crop estimates compiled by Statistics Canada, while U.S. corn futures slid to a one-week low and soybean futures lost ground on Tuesday.
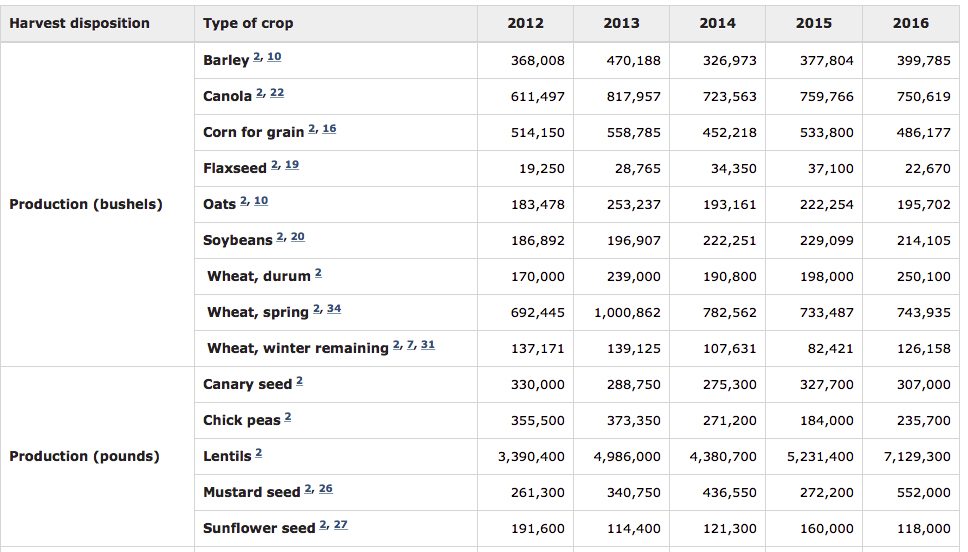
Statistics Canada pegged this year’s canola crop production at just over 17 million tonnes, which was below what most analysts had been expecting. Last year, Canada produced 17.2 million tonnes.
Gains in Malaysian palm oil and crude oil helped underpin the market.
The November contract seems to have found support at the C$470 per tonne mark.
However, declines in Chicago Board of Trade soybeans were bearish for values.
The Canadian dollar was stronger relative to its US counterpart, which also made canola less attractive on the international market.
The deadline for China to lower the amount of dockage it accepts on imports of Canadian canola is fast approaching (September 1), which is at the back of investors’ minds.
Around 18,633 canola contracts were traded on Tuesday, which compares with Monday when around 16,529 contracts changed hands.
 Statistics Canada production estimates, released August 23, 2016.]
Soybean futures at the Chicago Board of Trade fell one to two US cents on Tuesday with favorable weather forecasts and reports of record yields.
Soybeans boast the second highest ratings in the past 30 years, according to USDA federal data, weighing on prices.
The ratings added to optimism about soybeans turning out record crops this year.
Scattered showers forecast throughout the U.S. Farm Belt will benefit crops further as autumn harvest approaches, also weighing on the market.
Soyoil prices traded both sides of unchanged on Tuesday, with the September contract closing at 33.89 US cents per pound for the second day in a row, while the October contract rose 2 cents to settle at 34.04 US cents per pound.
Soymeal weakened on Tuesday.
Corn futures fell four to five US cents on Tuesday as field reports from the Midwest crop tour failed to provoke market buying.
Conditions of corn crops improved last week, according to USDA federal data, and favorable weather is expected to continue in the next few weeks, weighing on prices.
Crop scouts across Ohio and South Dakota reported some of the worst corn yields so far on the Midwest crop tour, limiting losses. However, the figures were expected and reports will likely improve as scouts continue to move into the heart of the Corn Belt.
Total wheat production in Canada is expected to reach 30.5 million tonnes in 2016, up from 27.6 million tonnes in 2015, according to the Statistics Canada crop production report. This could mark the second time in 25 years wheat production will exceed 30 million tonnes.
Wheat closed lower on Tuesday, dropping around seven US cents per bushel.
Spring wheat is 65 percent harvested, according to the USDA weekly wheat progress report, which compares to 48 percent a week ago, weighing on prices.
Progress of the U.S. wheat crop is well above the 10-year average at this time of year, which is 51 per cent.
The 2016 US winter wheat yield is expected to set a new record-high of 53.9 bushels per acre, according to the USDA’s July 14 wheat outlook. If realized, it would be up 11.4 bushels per acre from last year.
Canadian pulse producers are anticipating larger crops than 2015, according to Statistics Canada’s crop production report. Lentil production is estimated to be 3.2 million tonnes, compared to 2.4 million in 2015, dry peas are forecast at 4.6 million tonnes in 2015, compared to 3.2 million in 2015.
Top end green pea prices dropped 30 Canadian cents in Western Canada, settling at C$8.00 per bushel, according to Prairie Ag Hotwire.
Top lentil prices in Western Canada saw some increases, according to Prairie Ag Hotwire. Laird number two lentils rose one Canadian cent to sit at 45 Canadian cents per pound, Eston number one lentils rose one cent to 41 Canadian cents per pound, and Eston X3 lentils rose 4 cents to 34 Canadian cents per pound.
Kabuli chickpea prices dropped one to two Canadian cents per pound yesterday in Western Canada, according to Prairie Ag Hotwire.
Oil rallied after Reuters reported that Iran was sending positive signals that it may support joint OPEC action to prop up the market. U.S. crude oil futures settled up 69 cents at $48.10 a barrel.
The oil-related news helped push the Canadian dollar through resistance around C$1.2900.
Light crude oil nearby futures in New York were up 69 cents to US$48.10 per barrel.
The Canadian dollar at noon was US77.51 cents, up from 77.27 cents the previous trading day. The U.S. dollar at noon was C$1.2902.
Winnipeg ICE Futures Canada dollars per tonne
Canola Nov 2016 472.20 +1.70 +0.36%
Canola Jan 2017 478.70 +1.70 +0.36%
Canola Mar 2017 484.20 +2.10 +0.44%
Canola May 2017 488.20 +2.20 +0.45%
Canola Jul 2017 491.80 +2.20 +0.45%
Milling Wheat Oct 2016 214.00 -3.00 -1.38%
Milling Wheat Dec 2016 217.00 -3.00 -1.36%
Milling Wheat Mar 2017 221.00 -3.00 -1.34%
Durum Wheat Oct 2016 261.00 unch 0.00%
Durum Wheat Dec 2016 264.00 unch 0.00%
Durum Wheat Mar 2017 269.00 unch 0.00%
Barley Oct 2016 138.00 unch 0.00%
Barley Dec 2016 138.00 unch 0.00%
Barley Mar 2017 140.00 unch 0.00%
Soybeans Sep 2016 1034.25 -1.00 -0.10%
Soybeans Nov 2016 1013.50 -2.25 -0.22%
Soybeans Jan 2017 1014.25 -2.50 -0.25%
Soybeans Mar 2017 1010.75 -1.25 -0.12%
Soybeans May 2017 1007.75 -1.00 -0.10%
Soybeans Jul 2017 1006.50 -1.00 -0.10%
Soybean Meal Sep 2016 332.40 -1.80 -0.54%
Soybean Meal Oct 2016 330.50 -1.70 -0.51%
Soybean Meal Dec 2016 328.50 -2.30 -0.70%
Soybean Oil Sep 2016 33.89 unch 0.00%
Soybean Oil Oct 2016 34.04 +0.02 +0.06%
Soybean Oil Dec 2016 34.32 +0.01 +0.03%
Corn Sep 2016 328.50 -4.75 -1.43%
Corn Dec 2016 337.25 -5.25 -1.53%
Corn Mar 2017 347.00 -5.25 -1.49%
Corn May 2017 353.75 -5.25 -1.46%
Corn Jul 2017 360.75 -4.75 -1.30%
Oats Sep 2016 171.50 -0.75 -0.44%
Oats Dec 2016 186.25 -1.50 -0.80%
Oats Mar 2017 198.50 unch 0.00%
Oats May 2017 201.75 -1.50 -0.74%
Oats Jul 2017 207.25 -1.50 -0.72%
Wheat Sep 2016 407.75 -7.50 -1.81%
Wheat Dec 2016 427.50 -7.75 -1.78%
Wheat Mar 2017 450.00 -8.00 -1.75%
Wheat May 2017 464.50 -8.50 -1.80%
Wheat Jul 2017 473.50 -7.50 -1.56%
Spring Wheat Sep 2016 515.75 -16.25 -3.05%
Spring Wheat Dec 2016 515.75 -8.75 -1.67%
Spring Wheat Mar 2017 526.00 -7.00 -1.31%
Spring Wheat May 2017 535.00 -6.00 -1.11%
Spring Wheat Jul 2017 543.50 -5.75 -1.05%
Hard Red Wheat Sep 2016 407.25 -6.50 -1.57%
Hard Red Wheat Dec 2016 433.50 -6.50 -1.48%
Hard Red Wheat Mar 2017 449.75 -6.25 -1.37%
Hard Red Wheat May 2017 460.25 -5.75 -1.23%
Hard Red Wheat Jul 2017 469.75 -5.75 -1.21%
Live Cattle (P) Aug 2016 113.25 -0.17 -0.15%
Live Cattle (P) Oct 2016 109.72 -0.63 -0.57%
Live Cattle (P) Dec 2016 110.98 -0.74 -0.66%
Feeder Cattle (P) Aug 2016 146.45 -0.58 -0.39%
Feeder Cattle (P) Sep 2016 143.92 -0.51 -0.35%
Feeder Cattle (P) Oct 2016 140.45 -1.10 -0.78%
Lean Hogs (P) Oct 2016 60.52 -0.63 -1.03%
Lean Hogs (P) Dec 2016 56.52 -0.53 -0.93%
Lean Hogs (P) Feb 2017 61.28 -0.55 -0.89%


