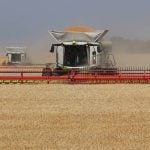
ICE Canada canola on Monday reached five-week highs on its most-active contract, due to short-covering ahead of Statistics Canada’s first production estimates of the year.
Statistics Canada will report Tuesday, while a Reuters trade survey predicts the Canadian canola crop to be second-largest ever.
November canola added $1.30 at $470.50 per tonne, January canola gained $1.50 at $477, while November-January canola spread traded 2,813 times.
Soybean futures on the Chicago Board of Trade rose Monday, with the benchmark November contract hitting a one-month high on export demand for U.S. supplies, traders said.
Read Also
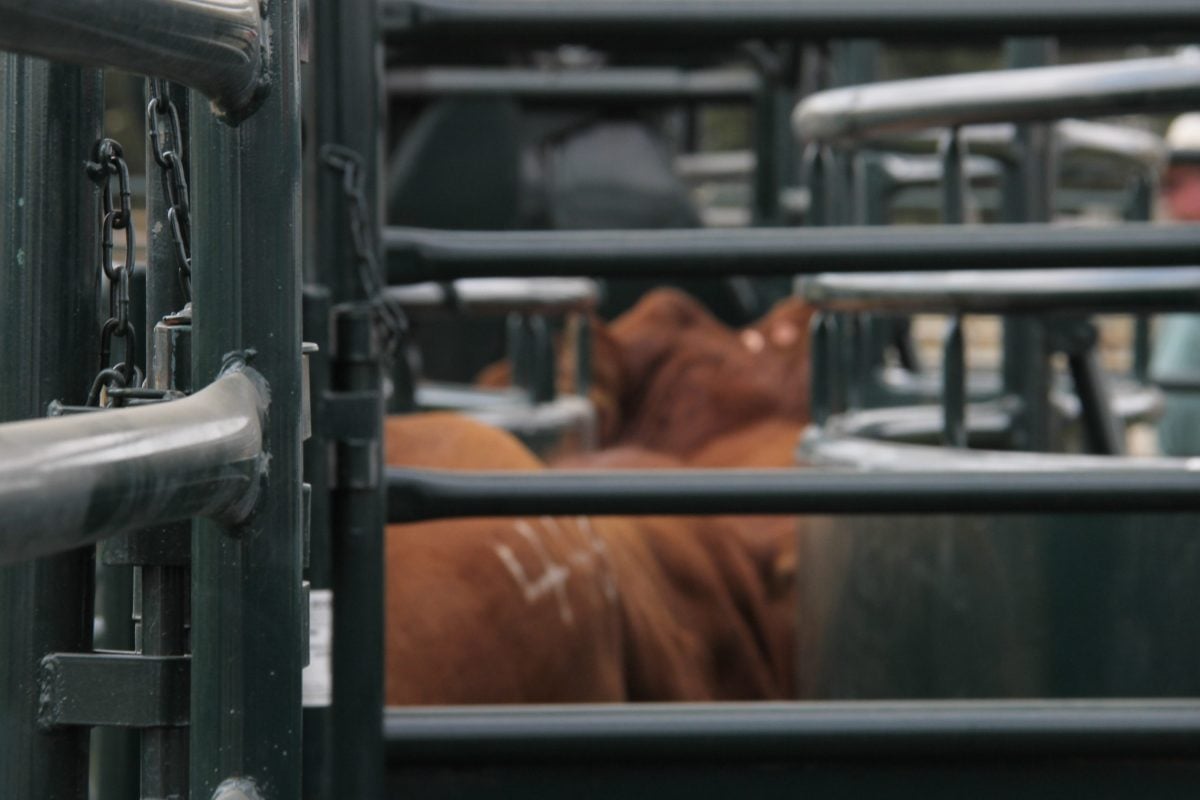
U.S. livestock: Cattle futures end lower in profit-taking, technical correction
Chicago Mercantile Exchange cattle futures declined for a second straight session on Wednesday in a profit-taking and technical-selling correction from recent highs.
CBOT November soybeans settled up 11-1/4 cents at US $10.15-3/4 per bushel after reaching US $10.20, the highest since July 21.
Gains were limited by forecasts for good weather for final stages of the soybean crop development in the U.S. Midwest.
The federal government’s good/excellent rating for soybeans on Monday was 72 percent, the same as a week ago.
On a annual crop tour in southeastern South Dakota, scouts found soybean pod counts averaged 1,121.7 pods, above the tour’s three-year average of 981.6.
In 2015, the tour found 1,029.8 pod counts in the area.
Scouts do not estimate soybean yields but calculate the number of pods in three-by-three foot plots to gauge yield potential.
In the Chicago Board of Trade, corn futures drifted lower on Monday on technical selling after a six-session advance, and spillover weakness from outside commodities including energies.
The U.S. Department of Agriculture’s weekly crop condition report on Monday afternoon rated corn condition 75 percent good/excellent versus 74 percent a week ago.
Average corn yields in southeastern South Dakota were below average and signs of growing-season stress were evident.
Missing grain on the ends of corn ears and an indication of dryness and excess heat during pollination, brought down overall yield projections, scouts said on the first day of the Pro Farmer Midwest Crop Tour.
Spot basis bids on Monday for hard red winter wheat in the southern U.S. Plains were steady following weaker futures prices.
Wheat futures on the Chicago Board of Trade closed lower Monday, led by the front September contract on technical selling and a lack of fresh supportive news, traders said.
Plentiful world supplies and poor export demand for U.S. wheat continued to serve as an anchor on prices.
Light crude oil nearby futures in New York were down $1.47 to US$47.05 per barrel.
The Canadian dollar at noon was US77.27 cents, down from 77.65 cents the previous trading day. The U.S. dollar at noon was C$1.2942.
Winnipeg ICE Futures Canada dollars per tonne
Canola Nov 2016 470.50 +1.30 +0.28%
Canola Jan 2017 477.00 +1.50 +0.32%
Canola Mar 2017 482.10 +1.10 +0.23%
Canola May 2017 486.00 +1.00 +0.21%
Canola Jul 2017 489.60 +1.30 +0.27%
Milling Wheat Oct 2016 217.00 -1.00 -0.46%
Milling Wheat Dec 2016 220.00 -1.00 -0.45%
Milling Wheat Mar 2017 224.00 unch 0.00%
Durum Wheat Oct 2016 261.00 unch 0.00%
Durum Wheat Dec 2016 264.00 unch 0.00%
Durum Wheat Mar 2017 269.00 unch 0.00%
Barley Oct 2016 138.00 unch 0.00%
Barley Dec 2016 138.00 unch 0.00%
Barley Mar 2017 140.00 unch 0.00%
Soybeans Sep 2016 1035.25 +7.75 +0.75%
Soybeans Nov 2016 1015.75 +11.75 +1.17%
Soybeans Jan 2017 1016.75 +12.50 +1.24%
Soybeans Mar 2017 1012.00 +12.75 +1.28%
Soybeans May 2017 1008.75 +13.25 +1.33%
Soybeans Jul 2017 1007.50 +11.50 +1.15%
Soybean Meal Sep 2016 334.20 +4.10 +1.24%
Soybean Meal Oct 2016 332.20 +4.90 +1.50%
Soybean Meal Dec 2016 330.80 +5.30 +1.63%
Soybean Oil Sep 2016 33.89 -0.21 -0.62%
Soybean Oil Oct 2016 34.02 -0.22 -0.64%
Soybean Oil Dec 2016 34.31 -0.18 -0.52%
Corn Sep 2016 333.25 -1.00 -0.30%
Corn Dec 2016 342.50 -1.50 -0.44%
Corn Mar 2017 352.25 -1.75 -0.49%
Corn May 2017 359.00 -1.50 -0.42%
Corn Jul 2017 365.50 -1.75 -0.48%
Oats Sep 2016 172.25 +3.25 +1.92%
Oats Dec 2016 187.75 +3.50 +1.90%
Oats Mar 2017 198.50 +2.25 +1.15%
Oats May 2017 203.25 +3.50 +1.75%
Oats Jul 2017 208.75 +3.75 +1.83%
Wheat Sep 2016 415.25 -11.50 -2.69%
Wheat Dec 2016 435.25 -9.50 -2.14%
Wheat Mar 2017 458.00 -6.00 -1.29%
Wheat May 2017 473.00 -4.00 -0.84%
Wheat Jul 2017 481.00 -3.50 -0.72%
Spring Wheat Sep 2016 532.00 +1.00 +0.19%
Spring Wheat Dec 2016 524.50 -2.25 -0.43%
Spring Wheat Mar 2017 533.00 -2.25 -0.42%
Spring Wheat May 2017 541.00 -2.00 -0.37%
Spring Wheat Jul 2017 549.25 -2.00 -0.36%
Hard Red Wheat Sep 2016 413.75 -4.75 -1.14%
Hard Red Wheat Dec 2016 440.00 -4.50 -1.01%
Hard Red Wheat Mar 2017 456.00 -3.75 -0.82%
Hard Red Wheat May 2017 466.00 -5.75 -1.22%
Hard Red Wheat Jul 2017 475.50 -3.50 -0.73%
Live Cattle (P) Aug 2016 113.42 +0.02 +0.02%
Live Cattle (P) Oct 2016 110.35 +0.05 +0.05%
Live Cattle (P) Dec 2016 111.72 -0.03 -0.03%
Feeder Cattle (P) Aug 2016 147.02 +1.07 +0.73%
Feeder Cattle (P) Sep 2016 144.42 +0.72 +0.50%
Feeder Cattle (P) Oct 2016 141.55 +0.60 +0.43%
Lean Hogs (P) Oct 2016 61.15 -0.93 -1.50%
Lean Hogs (P) Dec 2016 57.05 -0.65 -1.13%
Lean Hogs (P) Feb 2017 61.82 -0.16 -0.26%