Canola futures rose for the fourth consecutive trading day, supported by talk of export sales and stronger soy oil futures.
Farmers are not delivering and the futures trade in canola is light. Reuters reported talk of export business but there were no details.
With wet fields and lots of humidity, rain storms are popping up this afternoon. A more general rain is forecast for southern Alberta and southwestern Saskatchewan in the 24 hours from tonight to Wednesday night.
Big funds are net short in canola and there could have been some short covering today.
Read Also

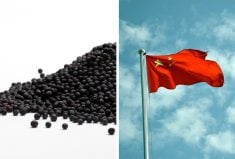
Canada and China discuss disputes over canola and EVs, says Ottawa
Senior Canadian and Chinese officials discussed bilateral trade disputes involving canola and electric vehicles on Friday, Ottawa said, but gave no indication of any immediate breakthrough.
Excessive rain across much of the Canadian Prairies has also put some weather premium into the canola market.
Canola has also benefitted from the fact that soy oil has been generally rising since late July with support from tight palm oil physical supplies.
Previously, soy meal had been the leader in the soy complex but in recent days it is the oil component that is showing a little life.
Soybeans today were supported by another U.S. export sale. The USDA has announced daily soybean sales in each of the last 10 trading sessions.
Corn edged lower on expectations that the USDA on Friday will raise its estimate of the yield and overall size of the American corn crop.
Midwest weather is generally conducive to crop growth and the USDA on Friday is also expected to increase its soybean production estimate.
France has severe problems with its wheat crop and will export much less this year, but expectations are the slack will be taken up by big crops in eastern Europe and the Black Sea region.
A bit of bullish news came from Brazil where the government forecaster cuts its estimate of the country’s 2015-16 corn crop to 68.48 million tonnes, from 69.14 million in July and last year’s 84.67 million tonnes.
The country’s second corn crop has been a major disappointment.
The USDA late Monday rated the American corn crop at 74 percent good to excellent, down from 76 percent the previous week. Analysts surveyed by Reuters had expected a rating of 75 percent good-to-excellent.
The soybean crop was rated 72 percent good to excellent, unchanged from the previous week and in line with trade expectations.
The USDA said the U.S. spring wheat harvest was 30 percent complete, ahead of the five-year average of 18 percent. The U.S. winter wheat harvest was 94 percent complete.
The U.S. agricultural attaché in China recently issued a report on China’s oilseed demand for 2016-17.
It expects China’s total rapeseed imports to be 3.9 million tonnes in 2016-17, slightly more than the official USDA forecast of 3.8 million tonnes and the same as 2015-16.
Chinese rapeseed production is expected to fall 5.6 percent to 13.5 million tonnes, mostly due to reduced acreage.
It notes that uncertainty hangs over the market because of China’s intention to implement new stricter foreign matter content rules in September.
Negotiations continue between Canada and China about the latter’s intention to move to a one percent dockage rule from the current 2.5 percent.
China has been selling state owned rapeseed oil supplies and that could limit seed imports. Also an expected smaller global rapeseed crop could limit the amount China buys, the attaché wrote.
“That said, a significant fall in rapeseed imports is not expected given China’s large crushing capacity and smaller than officially reported domestic production,” the attaché wrote.
Light crude oil nearby futures in New York were down 25 cents to US$42.77 per barrel.
The Canadian dollar at noon was US76.24 cents, up from 75.96 cents the previous trading day. The U.S. dollar at noon was C$1.3117.
The Toronto Stock Exchange’s S&P/TSX composite index closed up 45.61 points, or 0.31 percent, at 14,801.23.
The Nasdaq Composite added 0.24 percent to post a new record high at 5,225.48 points.
The Dow Jones industrial average edged up 0.02 percent to end at 18,533.05 points and the S&P 500 inched up 0.04 percent to 2,181.74.
Winnipeg ICE Futures Canada dollars per tonne
Canola Nov 2016 459.70 +5.70 +1.26%
Canola Jan 2017 465.90 +5.30 +1.15%
Canola Mar 2017 471.40 +5.20 +1.12%
Canola May 2017 476.70 +4.50 +0.95%
Canola Jul 2017 480.30 +2.90 +0.61%
Milling Wheat Oct 2016 211.00 +1.00 +0.48%
Milling Wheat Dec 2016 214.00 unch 0.00%
Milling Wheat Mar 2017 219.00 unch 0.00%
Durum Wheat Oct 2016 260.00 unch 0.00%
Durum Wheat Dec 2016 263.00 unch 0.00%
Durum Wheat Mar 2017 268.00 unch 0.00%
Barley Oct 2016 138.00 unch 0.00%
Barley Dec 2016 138.00 unch 0.00%
Barley Mar 2017 140.00 unch 0.00%
American crop prices in cents US/bushel, soybean meal in $US/short ton, soy oil in cents US/pound
Chicago
Soybeans Aug 2016 1022.00 +3.25 +0.32%
Soybeans Sep 2016 1005.00 +3.75 +0.37%
Soybeans Nov 2016 988.00 +3.00 +0.30%
Soybeans Jan 2017 986.75 +2.00 +0.20%
Soybeans Mar 2017 976.00 unch 0.00%
Soybeans May 2017 974.00 -0.75 -0.08%
Soybean Meal Aug 2016 339.20 +1.30 +0.38%
Soybean Meal Sep 2016 336.30 +0.40 +0.12%
Soybean Meal Oct 2016 334.60 +0.50 +0.15%
Soybean Oil Aug 2016 31.17 +0.24 +0.78%
Soybean Oil Sep 2016 31.24 +0.23 +0.74%
Soybean Oil Oct 2016 31.37 +0.23 +0.74%
Corn Sep 2016 322.25 -3.00 -0.92%
Corn Dec 2016 332.50 -2.25 -0.67%
Corn Mar 2017 343.00 -2.00 -0.58%
Corn May 2017 349.75 -2.00 -0.57%
Corn Jul 2017 356.00 -2.25 -0.63%
Oats Sep 2016 175.25 -1.25 -0.71%
Oats Dec 2016 184.00 -1.50 -0.81%
Oats Mar 2017 193.25 -1.75 -0.90%
Oats May 2017 197.25 -2.75 -1.38%
Oats Jul 2017 203.75 -1.25 -0.61%
Wheat Sep 2016 417.00 unch 0.00%
Wheat Dec 2016 436.75 -2.00 -0.46%
Wheat Mar 2017 459.25 -0.50 -0.11%
Wheat May 2017 471.75 +0.25 +0.05%
Wheat Jul 2017 479.00 +0.50 +0.10%
Minneapolis
Spring Wheat Sep 2016 498.25 -1.25 -0.25%
Spring Wheat Dec 2016 507.50 unch 0.00%
Spring Wheat Mar 2017 521.50 +1.00 +0.19%
Spring Wheat May 2017 530.25 +1.50 +0.28%
Spring Wheat Jul 2017 539.75 +2.25 +0.42%
Kansas City
Hard Red Wheat Sep 2016 410.00 +0.25 +0.06%
Hard Red Wheat Dec 2016 435.50 +0.50 +0.11%
Hard Red Wheat Mar 2017 452.25 +0.50 +0.11%
Hard Red Wheat May 2017 463.25 +0.50 +0.11%
Hard Red Wheat Jul 2017 472.00 +0.25 +0.05%
Chicago livestock futures in US¢/pound (rounded to two decimal places)
Live Cattle (P) Aug 2016 116.98 +0.06 +0.05%
Live Cattle (P) Oct 2016 115.00 +0.35 +0.31%
Live Cattle (P) Dec 2016 115.98 +0.56 +0.49%
Feeder Cattle (P) Aug 2016 150.18 +1.06 +0.71%
Feeder Cattle (P) Sep 2016 148.85 +1.65 +1.12%
Feeder Cattle (P) Oct 2016 146.02 +1.72 +1.19%
Lean Hogs (P) Aug 2016 66.92 -0.18 -0.27%
Lean Hogs (P) Oct 2016 58.20 -0.65 -1.10%
Lean Hogs (P) Dec 2016 54.40 -0.33 -0.60%