
Canola followed the generally falling U.S. crop market lower on Tuesday.
November canola fell 1.4 percent Tuesday compared to a 0.88 percent decline in November soybeans.
However, soybean had also fallen on Monday when the ICE Futures Canada exchange was closed.
Over Monday and Tuesday soybeans fell a combined five percent with traders liquidating their long positions in the face of generally good growing weather in the U.S. Midwest.
Crops in Western Canada are also generally good aside from those stressed by excess moisture.
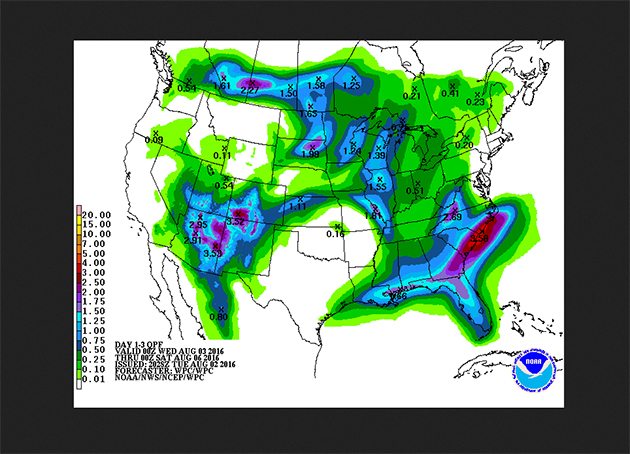
Much of Alberta got rain over the long weekend. Parts of Saskatchewan and Manitoba also got rain, although the heaviest accumulations were east of Winnipeg.
Another system developing tonight and into Wednesday is expected to bring 0.75 to 1.5 inches to much of central Alberta and western Saskatchewan, according to forecast maps from the U.S. Weather Service. Environment Canada has a rainfall warning for up to 50 millimetres or about two inches for west central Alberta by Wednesday afternoon.
Read Also

New Quebec ag minister named in shuffle
Farmers in Quebec get a new representative at the provincial cabinet table as Premier Francois Legault names Donald Martel the new minister of agriculture, replacing Andre Lamontagne.
The rain moves to eastern Saskatchewan and Manitoba on Thursday.
In total, areas on the Alberta-Saskatchewan border could get two inches from the system this week, according to the U.S. Weather Service forecast maps.
On Monday the U.S. Department of Agriculture said 72 percent of the U.S. soybean crop was good to excellent, up from 71 percent the previous week. Analysts had expected a decline in ratings.
The corn crop was 76 percent good to excellent, unchanged from the previous week.
The spring wheat crop was 68 percent good to excellent, also unchanged from the week before.
The USDA said the U.S. spring wheat harvest was 10 percent complete, and the winter wheat harvest was 89 percent complete.
Chicago Board of Trade wheat futures closed lower with the front contract dipping below US$4 a bushel for the first time in a decade. However, new crop December spring wheat edged a half penny higher closing just above $5.
Commodity brokerage INTL FCStone late Monday projected U.S. 2016 corn production at 15.146 billion bushels, with a record-high yield of 175 bu. per acre. It pegged soybeans at 48.8 bu per acre versus the current USDA forecast of 46.7 bu. per acre. That would put the crop at a record 4.054 billion bushels versus USDA forecast of 3.88 billion.
The current USDA forecast is 14.54 billion bushels and a yield of 168 bushels an acre. The USDA will update its supply and demand forecasts on Aug. 12.
U.S. crude oil slid back below $40 a barrel on worries of an oil glut. Traders are also watching a surplus of petroleum products such as gasoline and diesel that are weighing down the price.
INIDAI PULSE CROP
India’s government today released its fourth and final estimate of the 2015-16 crop and it was slightly bullish for pulses.
Pulse production for the year was pegged at 16.47 million tonnes, down from the previous estimate of 17.06 million and last year’s 17.15 million.
The wheat crop was also a little smaller than the previous estimate but nowhere near as bad as some private traders had forecast earlier this year.
The government put the wheat crop at 93.5 million tonnes, down from about 94 million in the last estimate but well up from 86.5 million last year.
Most of the wheat crop in India is irrigated but the majority of the pulse crop is rain fed.
Light crude oil nearby futures in New York fell 55 cents to US$39.51 per barrel.
The Canadian dollar at noon was US76.40 cents, down from 76.68 cents the previous trading day. The U.S. dollar at noon was C$1.3041.
The lower oil price and weaker than expected U.S. monthly auto sales pressure stock markets.
The Toronto Stock Exchange’s S&P/TSX composite index closed down 105.73 points, or 0.73 percent, at 14,477.01.
The Dow Jones industrial average fell 90.74 points, or 0.49 percent, to 18,313.77, the S&P 500 lost 13.81 points, or 0.64 percent, to 2,157.03 and the Nasdaq Composite dropped 46.46 points, or 0.9 percent, to 5,137.73.
Winnipeg ICE Futures Canada dollars per tonne
Canola Nov 2016 447.50 -6.40 -1.41%
Canola Jan 2017 453.90 -6.40 -1.39%
Canola Mar 2017 460.50 -6.20 -1.33%
Canola May 2017 465.30 -6.40 -1.36%
Canola Jul 2017 469.60 -6.40 -1.34%
Milling Wheat Oct 2016 205.00 -2.00 -0.97%
Milling Wheat Dec 2016 209.00 -2.00 -0.95%
Durum Wheat Oct 2016 260.00 unch 0.00%
Durum Wheat Dec 2016 263.00 unch 0.00%
Barley Oct 2016 138.00 unch 0.00%
Barley Dec 2016 138.00 unch 0.00%
American crop prices in cents US/bushel, soybean meal in $US/short ton, soy oil in cents US/pound
Chicago
Soybeans Aug 2016 985.25 -10.75 -1.08%
Soybeans Sep 2016 971.25 -10.00 -1.02%
Soybeans Nov 2016 953.00 -8.50 -0.88%
Soybeans Jan 2017 954.25 -7.75 -0.81%
Soybeans Mar 2017 948.50 -5.00 -0.52%
Soybeans May 2017 947.50 -3.00 -0.32%
Soybean Meal Aug 2016 328.40 -5.60 -1.68%
Soybean Meal Sep 2016 328.30 -5.40 -1.62%
Soybean Meal Oct 2016 327.70 -5.10 -1.53%
Soybean Oil Aug 2016 30.06 +0.31 +1.04%
Soybean Oil Sep 2016 30.18 +0.31 +1.04%
Soybean Oil Oct 2016 30.29 +0.31 +1.03%
Corn Sep 2016 324.25 -1.50 -0.46%
Corn Dec 2016 334.00 -0.25 -0.07%
Corn Mar 2017 343.75 +0.50 +0.15%
Corn May 2017 350.50 +1.50 +0.43%
Corn Jul 2017 356.75 +2.00 +0.56%
Oats Sep 2016 195.50 -4.25 -2.13%
Oats Dec 2016 190.75 -6.75 -3.42%
Oats Mar 2017 199.00 -3.00 -1.49%
Oats May 2017 205.50 -1.75 -0.84%
Oats Jul 2017 211.25 -1.75 -0.82%
Minneapolis
Wheat Sep 2016 401.25 -4.75 -1.17%
Wheat Dec 2016 428.00 -5.00 -1.15%
Wheat Mar 2017 454.50 -4.00 -0.87%
Wheat May 2017 468.75 -3.25 -0.69%
Wheat Jul 2017 476.25 -3.50 -0.73%
Kansas City
Spring Wheat Sep 2016 486.50 +1.75 +0.36%
Spring Wheat Dec 2016 500.75 +0.50 +0.10%
Spring Wheat Mar 2017 515.50 unch 0.00%
Spring Wheat May 2017 525.00 -0.25 -0.05%
Spring Wheat Jul 2017 534.25 -0.50 -0.09%
Hard Red Wheat Sep 2016 406.50 -2.75 -0.67%
Hard Red Wheat Dec 2016 433.00 -2.50 -0.57%
Hard Red Wheat Mar 2017 450.00 -2.50 -0.55%
Hard Red Wheat May 2017 460.50 -2.75 -0.59%
Hard Red Wheat Jul 2017 469.75 -2.50 -0.53%
Chicago livestock futures in US¢/pound
Live Cattle (P) Aug 2016 116.22 +0.30 +0.26%
Live Cattle (P) Oct 2016 114.58 +0.50 +0.44%
Live Cattle (P) Dec 2016 114.88 +0.28 +0.24%
Feeder Cattle (P) Aug 2016 145.48 +0.93 +0.64%
Feeder Cattle (P) Sep 2016 143.88 +0.81 +0.57%
Feeder Cattle (P) Oct 2016 142.08 +0.21 +0.15%
Lean Hogs (P) Aug 2016 68.92 +0.27 +0.39%
Lean Hogs (P) Oct 2016 60.52 -0.08 -0.13%
Lean Hogs (P) Dec 2016 56.25 -0.25 -0.44%