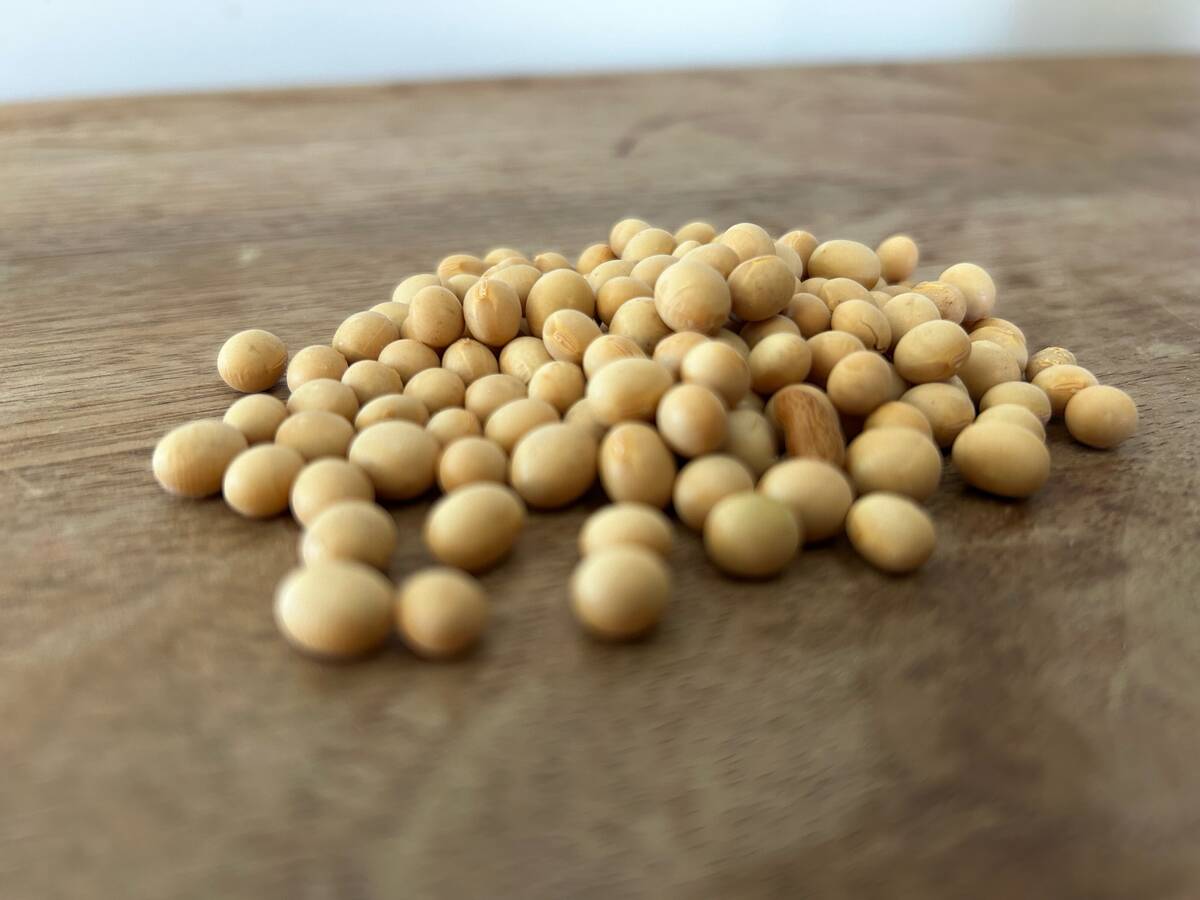
Short covering and a new bit of weather risk premium caused nearby soybeans to rise one percent Tuesday and canola hitched a ride.
November canola closed up $3.20 a tonne of 0.72 percent.
Generally good weather in Western Canada kept a lid on gains.
There is little chance for widespread rain in Western Canada this week, although southern Alberta could see a series of thunderstorms over the next few days.
Nearby Chicago wheat fell 3.26 percent and Minneapolis spring wheat fell 2.11 percent, reflecting lower wheat futures on the Euronext exchange. That wiped out the gains of the previous three days.
Read Also
U.S. grains: soybeans firm ahead of USDA data
Chicago soybeans ticked up slightly on Wednesday as traders adjusted positions ahead of the release of official U.S. data on global supply and demand on Friday, the first update in weeks, but prices were capped by a lack of large Chinese purchases.
Euronext had previously rallied strongly on worse than expected results from the harvest in France.
European traders were waiting for more news about the French harvest and were also reconsidering their bullish bets, noting that crops elsewhere in Europe are in better shape than in France. Also, Russia is expecting a record large wheat harvest.
The Reuters closing report talked of a little weather premium going into soybeans because of some hot August weather, but the medium term forecast is not stressful for Midwest crops.
Temperatures to Aug. 9 look mostly seasonal to slightly cooler than average with the exeption of one hot day Aug. 2.
Soybeans should be able to handle a bit of stress. They are in excellent shape now.
The U.S. Department of Agriculture on Monday pegged the soybean crop at 71 percent good to excellent, ahead of market forecasts of 70 percent.
The extreme heat last week appeared to have no detrimental effect.
It pegged the corn crop at 76 percent good to excellent, beating analysts’ forecasts of 75 percent.
Most of the crop has now gone through its silking phase of pollination ahead of schedule, USDA data showed, giving investors confidence that the crop had escaped unscathed through its most vulnerable development period.
Corn futures slipped on Tuesday, consolidating just above 21-month lows hit on Friday, Reuters noted..
There were few sellers when prices neared the December contract’s lifetime low of $3.33 ¼ per bushel, but any move higher was likely to be met by selling both from speculative traders and farmers, analysts said.
Light crude oil nearby futures in New York were down 21 cents to US$42.92 per barrel.
The Canadian dollar at noon was US75.71 cents, down from 75.61 cents the previous trading day. The U.S. dollar at noon was C$1.3209.
The Toronto Stock Exchange’s S&P/TSX composite index closed up 51.90 points, or 0.36 percent, at 14,550.00.
The Dow Jones industrial average dipped 0.1 percent to end at 18,473.75 and the S&P 500 edged up 0.03 percent to 2,169.18 after spending much of the day at a loss. The Nasdaq Composite added 0.24 percent to 5,110.05.
Winnipeg ICE Futures Canada dollars per tonne
Canola Nov 2016 447.10 +3.20 +0.72%
Canola Jan 2017 454.60 +3.20 +0.17%
Canola Mar 2017 461.00 +2.80 +0.61%
Canola May 2017 465.00 +2.70 +0.58%
Canola Jul 2017 468.80 +3.00 +0.64%
Milling Wheat Oct 2016 208.00 -1.00 -0.48%
Milling Wheat Dec 2016 212.00 unch 0.00%
Durum Wheat Oct 2016 260.00 -1.00 -0.38%
Durum Wheat Dec 2016 263.00 -1.00 -0.38%
Barley Oct 2016 150.00 unch 0.00%
Barley Dec 2016 150.00 unch 0.00%
Soybeans Aug 2016 993.50 +9.75 +0.99%
Soybeans Sep 2016 985.00 +8.25 +0.84%
Soybeans Nov 2016 973.75 +7.50 +0.78%
Soybeans Jan 2017 974.50 +7.50 +0.78%
Soybeans Mar 2017 963.25 +8.50 +0.89%
Soybeans May 2017 959.00 +9.00 +0.95%
Soybean Meal Aug 2016 341.40 +2.50 +0.74%
Soybean Meal Sep 2016 341.20 +2.80 +0.83%
Soybean Meal Oct 2016 339.10 +3.30 +0.98%
Soybean Oil Aug 2016 29.56 +0.10 +0.34%
Soybean Oil Sep 2016 29.68 +0.11 +0.37%
Soybean Oil Oct 2016 29.80 +0.10 +0.34%
Corn Sep 2016 332.50 -2.25 -0.67%
Corn Dec 2016 339.50 -1.75 -0.51%
Corn Mar 2017 349.00 -2.00 -0.57%
Corn May 2017 354.50 -2.25 -0.63%
Corn Jul 2017 359.50 -2.50 -0.69%
Oats Sep 2016 200.25 -4.00 -1.96%
Oats Dec 2016 198.75 -0.75 -0.38%
Oats Mar 2017 203.75 -0.50 -0.24%
Oats May 2017 208.25 -0.50 -0.24%
Oats Jul 2017 214.00 -0.50 -0.23%
Wheat Sep 2016 415.00 -14.00 -3.26%
Wheat Dec 2016 442.00 -14.25 -3.12%
Wheat Mar 2017 469.25 -14.25 -2.95%
Wheat May 2017 482.25 -13.50 -2.72%
Wheat Jul 2017 489.25 -13.50 -2.69%
Spring Wheat Sep 2016 486.50 -10.50 -2.11%
Spring Wheat Dec 2016 502.50 -10.50 -2.05%
Spring Wheat Mar 2017 518.50 -10.50 -1.98%
Spring Wheat May 2017 528.75 -10.00 -1.86%
Spring Wheat Jul 2017 538.50 -10.00 -1.82%
Hard Red Wheat Sep 2016 412.00 -11.25 -2.66%
Hard Red Wheat Dec 2016 438.50 -11.00 -2.45%
Hard Red Wheat Mar 2017 455.50 -11.00 -2.36%
Hard Red Wheat May 2017 466.50 -11.00 -2.30%
Hard Red Wheat Jul 2017 476.25 -11.00 -2.26%
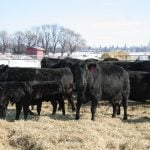
Live Cattle (P) Aug 2016 113.88 +0.93 +0.82%
Live Cattle (P) Oct 2016 112.58 +1.51 +1.36%
Live Cattle (P) Dec 2016 113.35 +1.15 +1.02%
Feeder Cattle (P) Aug 2016 142.45 +0.75 +0.53%
Feeder Cattle (P) Sep 2016 141.02 +0.70 +0.50%
Feeder Cattle (P) Oct 2016 140.22 +0.92 +0.66%
Lean Hogs (P) Aug 2016 74.60 -1.08 -1.43%
Lean Hogs (P) Oct 2016 63.62 -0.73 -1.13%
Lean Hogs (P) Dec 2016 58.50 -0.55 -0.93%