Canola futures finished Friday on a modest up note but overall were down over the five-day period, as commodity traders took a more cautious attitude and as weather was generally good across North America.
July canola closed at $510.50, up $1 or 0.2 percent.
New crop November closed at $518.10, up $3.10 or 0.6 percent.
For the week July canola fell $13 a tonne while November fell $7.40.
The gains in canola today lagged behind American crop markets, largely because of a one cent gain in the loonie.
The soy complex was generally up more than two percent and new crop corn was up almost three percent. Wheat followed corn higher.
Strong soybean export demand lent support to soybeans as did a weaker American dollar. Also, attitudes about Midwest weather shifted back toward the uncertain side of the ledger.
Read Also

NFU says proposed plant breeders’ rights come at farmers’ expense
The National Farmers Union is pushing back against changes to the Plant Breeders’ Rights Act that would narrow the scope of farmers’ right to save seed or propagate crops from cuttings and tubers.
A number of analysts this week have been downplaying the idea that an exceptionally hot dry summer will stress the American corn crop.
But a forecast of mostly dry conditions in the Midwest for this weekend put some weather risk back in the market today. The key will be July weather when corn flowers and establishes its yield potential. The current forecast for average corn yield is 168 bushels an acre.
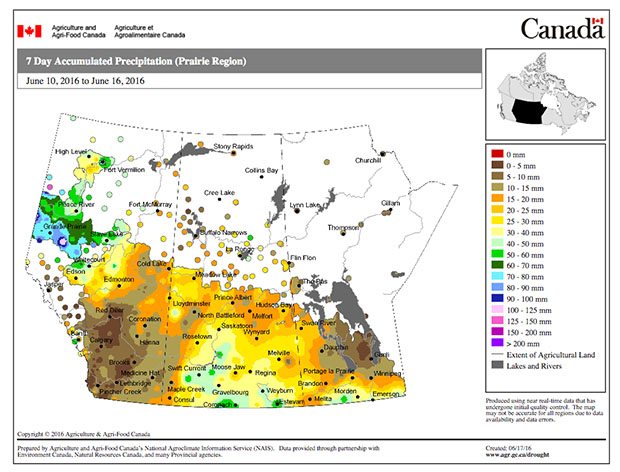
In Western Canada crops are generally developing nicely but there has been excessive rain in the past week in the Peace River-Dawson Creek region of northwest Alberta and British Colombia. The city of Dawson Creek issued a state of emergency to help cope with excessive rains that have washed out roads, bridges and even rail lines.
Rain is forecast for Sunday in areas of central and southern Saskatchewan and western Manitoba.
A strong accumulation of rain could develop the week June 25 to July 3 in the northern grain belt of Alberta and Saskatchewan according to maps from Center for Ocean-Land-Atmosphere Studies at George Mason University.
Indeed, weather models from the “NCEP coupled forecast system model version 2” show average to above-average rain in July in the Prairies.
This week’s canola exports totaled 181,400 tonnes, down from 197,400 tonnes last week but still on track to reach the 10 million tonne target for year set out in Agriculture Canada’s supply and demand projections.
Canola crush was 158,453 tonnes, down about nine percent from last week and 76.7 percent of capacity.
However, the domestic crush is also on track to meet its target of 8.1 million tonnes.
Uncertainty over the vote in Britain next week on whether to stay in the European Union continues but the assassination of a pro EU British politician this week has cooled the rhetoric.
Fears of an exit weighed down commodity markets this week, but crude oil jumped higher today.
India’s summer monsoon arrived this week, about a week behind schedule. Its arrival allows farmers to start seeding their summer crops.
Two weak monsoons hurt India’s crop production and helped fuel strong imports of Canadian pulse crops.
With the El Nino now over, expectations are for a better monsoon this year. The monsoon runs from June to September and feeds the summer crop and fills irrigation reservoirs for the winter crop.
Light crude oil nearby futures in New York were up $1.77 to US$47.98 per barrel.
The Canadian dollar at noon was US77.65 cents, up from 76.68 cents the previous trading day. The U.S. dollar at noon was C$1.2878.
The Toronto Stock Exchange’s S&P/TSX composite index closed up 19.36 points, or 0.14 percent, at 13,901.77,
The Dow Jones industrial average fell 57.94 points, or 0.33 percent, to 17,675.16, and the S&P 500 lost 6.77 points, or 0.33 percent, to 2,071.22. The Nasdaq Composite dropped 44.58 points, or 0.92 percent, to 4,800.34.
Winnipeg ICE Futures Canada dollars per tonne
Canola Jul 2016 510.50 +1.00 +0.20%
Canola Nov 2016 518.10 +3.10 +0.60%
Canola Jan 2017 523.10 +4.30 +0.83%
Canola Mar 2017 524.70 +4.80 +0.92%
Canola May 2017 526.50 +5.40 +1.04%
Milling Wheat Jul 2016 233.00 unch 0.00%
Milling Wheat Oct 2016 231.00 unch 0.00%
Durum Wheat Jul 2016 301.00 unch 0.00%
Durum Wheat Oct 2016 297.00 unch 0.00%
Barley Jul 2016 171.50 unch 0.00%
Barley Oct 2016 171.50 unch 0.00%
American crop prices in cents US/bushel, soybean meal in $US/short ton, soy oil in cents US/pound
Chicago
Soybeans Jul 2016 1159.50 +25.00 +2.20%
Soybeans Aug 2016 1160.00 +26.50 +2.34%
Soybeans Sep 2016 1151.75 +28.00 +2.49%
Soybeans Nov 2016 1148.25 +29.00 +2.59%
Soybeans Jan 2017 1146.00 +29.00 +2.60%
Soybeans Mar 2017 1107.50 +23.75 +2.19%
Soybean Meal Jul 2016 407.40 +9.70 +2.44%
Soybean Meal Aug 2016 406.70 +10.60 +2.68%
Soybean Meal Sep 2016 406.10 +10.90 +2.76%
Soybean Oil Jul 2016 31.93 +0.77 +2.47%
Soybean Oil Aug 2016 32.06 +0.76 +2.43%
Soybean Oil Sep 2016 32.19 +0.75 +2.39%
Corn Jul 2016 437.75 +12.50 +2.94%
Corn Sep 2016 442.75 +12.25 +2.85%
Corn Dec 2016 448.75 +13.00 +2.98%
Corn Mar 2017 452.50 +11.75 +2.67%
Corn May 2017 454.00 +11.00 +2.48%
Oats Jul 2016 208.25 +3.75 +1.83%
Oats Sep 2016 217.75 +2.75 +1.28%
Oats Dec 2016 225.25 +4.00 +1.81%
Oats Mar 2017 237.00 +3.50 +1.50%
Oats May 2017 237.00 +3.50 +1.50%
Wheat Jul 2016 481.25 +8.75 +1.85%
Wheat Sep 2016 494.75 +10.00 +2.06%
Wheat Dec 2016 513.00 +8.75 +1.74%
Wheat Mar 2017 531.25 +7.75 +1.48%
Wheat May 2017 542.75 +7.25 +1.35%
Minneapolis
Spring Wheat Jul 2016 539.75 +10.50 +1.98%
Spring Wheat Sep 2016 548.75 +10.00 +1.86%
Spring Wheat Dec 2016 561.75 +9.00 +1.63%
Spring Wheat Mar 2017 574.75 +9.50 +1.68%
Spring Wheat May 2017 582.75 +9.75 +1.70%
Kansas City
Hard Red Wheat Jul 2016 460.75 +10.00 +2.22%
Hard Red Wheat Sep 2016 478.50 +10.00 +2.13%
Hard Red Wheat Dec 2016 502.75 +9.00 +1.82%
Hard Red Wheat Mar 2017 518.50 +8.50 +1.67%
Hard Red Wheat May 2017 529.00 +8.50 +1.63%
Live Cattle (P) Jun 2016 116.72 -0.56 -0.48%
Live Cattle (P) Aug 2016 112.55 -0.80 -0.71%
Live Cattle (P) Oct 2016 112.65 -0.65 -0.57%
Feeder Cattle (P) Aug 2016 137.42 -2.21 -1.58%
Feeder Cattle (P) Sep 2016 136.65 -1.88 -1.36%
Feeder Cattle (P) Oct 2016 135.45 -1.70 -1.24%
Lean Hogs (P) Jul 2016 86.18 -0.89 -1.02%
Lean Hogs (P) Aug 2016 89.18 -0.32 -0.36%
Lean Hogs (P) Oct 2016 74.32 -0.18 -0.24%