A general flow of money into commodities helped lift crop futures prices Tuesday
Weakness in soy oil however limited the gain in canola.
July canola closed at $516.80, up 90 cents or 0.17 percent. In early morning trade July flirted briefly with $520
New crop November closed at $515.60, up $2.70 or 0.53 percent.
Crude oil rallied on reduced production in Canada, because of the forest fires around Fort McMurray, and in Nigeria.
Seeding in Canada advanced rapidly in warm weather.
Rain is expected late this week in Alberta and a series of rain events is expected to result in total accumulations over several days of an inch or more across much of the province.
Read Also
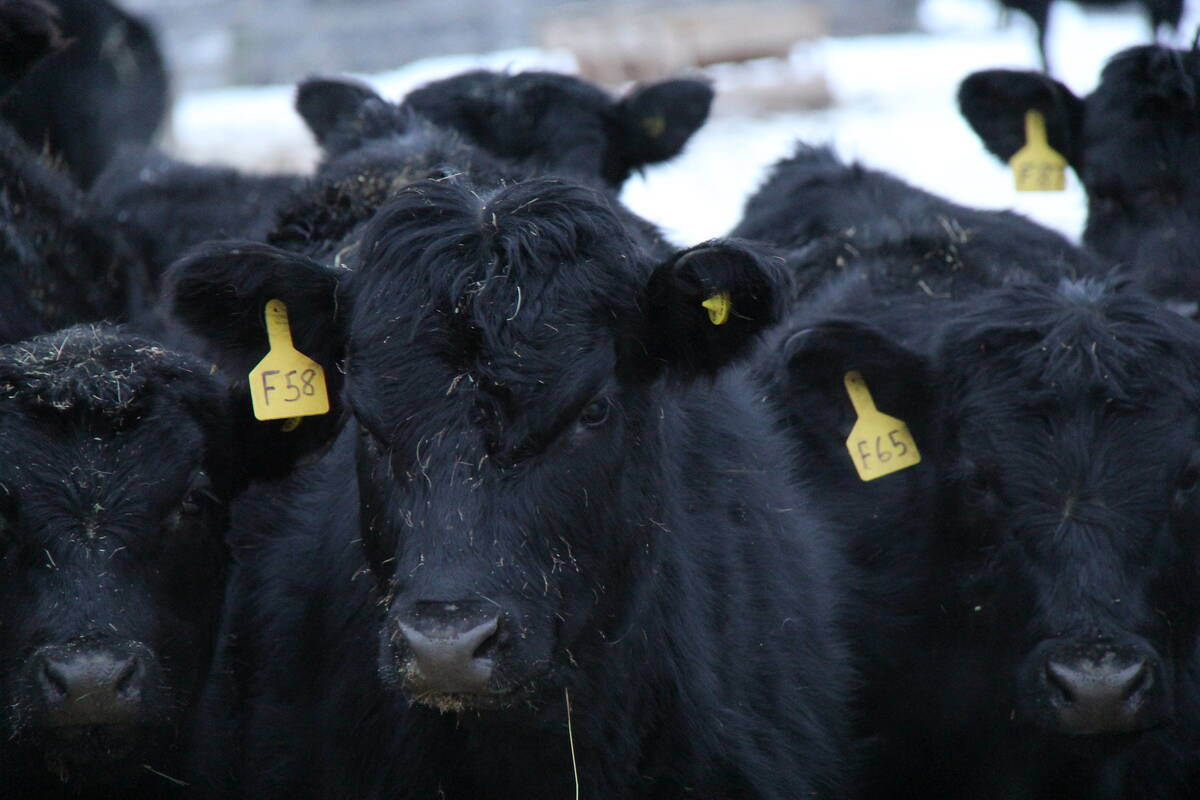
Under Trump, U.S. cedes its share of China’s beef market to Australia
Australian beef has replaced U.S. supply in China since President Donald Trump returned to the White House.
Southern Manitoba could get widespread rain next Monday-Tuesday.
Soybeans rallied, lead up by strong gains in soy meal.
New crop December corn broke through the psychologically important US$4 a bushel barrier, closing at $4.03 3/4. It closed right at $4 on Monday.
Previously it was above $4 for two days, April 21-22, and then before that it topped $4 for brief periods in December.
Wheat rose thanks to the capital inflow, with the biggest gains in the Chicago market and only a modest increase in Minneapolis spring wheat.
The fundamental news was not good. Crop analysts in Russia and Ukraine say spring conditions there are ideal. Analysts are raising their forecasts for Ukraine grain production as excellent spring weather is helping to partly offset the negative effects of the very dry seeding season last fall.
UkrAgroConsult increased its Ukrainian 2016 wheat crop forecast to 21.5 million tonnes from the previous estimate of 19.8 million tonnes. In early April it had forecast 18.5 million tonnes.
Light crude oil nearby futures in New York were up 59 cents to US$48.31 per barrel.
The Canadian dollar at noon was US77.61 cents, up from 77.60 cents the previous trading day. The U.S. dollar at noon was C$1.2885.
The stronger prices of oil and other commodities helped lift oil company and mining stocks while financial and consumer stocks fell. The TSX composite index finished up 23.61 points, or 0.17 percent, at 13,917.10.
American stock markets fell on ideas that the U.S. economy is doing well enough that the Federal Reserve could raise interest rates at its meeting in June. Three Fed officials today talked of the potential of rate hikes.
The Dow Jones industrial average fell 182.1 points, or 1.03 percent, to 17,528.61, the S&P 500 lost 19.55 points, or 0.95 percent, to 2,047.11 and the Nasdaq Composite dropped 59.73 points, or 1.25 percent, to 4,715.
Winnipeg ICE Futures Canada dollars per tonne
Canola Jul 2016 516.80 +0.90 +0.17%
Canola Nov 2016 515.60 +2.70 +0.53%
Canola Jan 2017 520.20 +3.50 +0.68%
Canola Mar 2017 521.00 +3.70 +0.72%
Canola May 2017 521.10 +3.60 +0.70%
Milling Wheat Jul 2016 241.00 +3.00 +1.26%
Milling Wheat Oct 2016 234.00 -1.00 -0.43%
Milling Wheat Dec 2016 239.00 unch 0.00%
Durum Wheat Jul 2016 297.00 unch 0.00%
Durum Wheat Oct 2016 291.00 unch 0.00%
Durum Wheat Dec 2016 293.00 unch 0.00%
Barley Jul 2016 171.00 -3.00 -1.72%
Barley Oct 2016 171.00 -3.00 -1.72%
Barley Dec 2016 171.00 -3.00 -1.72%
American crop prices in cents US/bushel, soybean meal in $US/short ton, soy oil in cents US/pound
Chicago
Soybeans Jul 2016 1080.25 +15.75 +1.48%
Soybeans Aug 2016 1082.5 +15.75 +1.48%
Soybeans Sep 2016 1073.75 +14.25 +1.34%
Soybeans Nov 2016 1067.25 +12.25 +1.16%
Soybeans Jan 2017 1064.5 +10.75 +1.02%
Soybeans Mar 2017 1043.5 +9.25 +0.89%
Soybean Meal Jul 2016 369.1 +7.9 +2.19%
Soybean Meal Aug 2016 366.5 +7.8 +2.17%
Soybean Meal Sep 2016 364.8 +7.6 +2.13%
Soybean Oil Jul 2016 32.78 -0.01 -0.03%
Soybean Oil Aug 2016 32.89 -0.01 -0.03%
Soybean Oil Sep 2016 33.01 -0.01 -0.03%
Corn Jul 2016 397 +3 +0.76%
Corn Sep 2016 399.75 +3.75 +0.95%
Corn Dec 2016 403.75 +3.75 +0.94%
Corn Mar 2017 411.5 +3.25 +0.80%
Corn May 2017 415.5 +3.25 +0.79%
Oats Jul 2016 196.5 -0.5 -0.25%
Oats Sep 2016 207.75 +0.25 +0.12%
Oats Dec 2016 219.5 +0.5 +0.23%
Oats Mar 2017 228.5 unch 0.00%
Oats May 2017 228.5 unch 0.00%
Wheat Jul 2016 481.75 +7 +1.47%
Wheat Sep 2016 491.25 +7.25 +1.50%
Wheat Dec 2016 506 +7 +1.40%
Wheat Mar 2017 520.75 +7 +1.36%
Wheat May 2017 529 +6.75 +1.29%
Minneapolis
Spring Wheat Jul 2016 539.25 +2 +0.37%
Spring Wheat Sep 2016 545.75 +1.5 +0.28%
Spring Wheat Dec 2016 556.75 +1.25 +0.23%
Spring Wheat Mar 2017 565.5 +1.5 +0.27%
Spring Wheat May 2017 571 +1.5 +0.26%
Kansas City
Hard Red Wheat Jul 2016 457.75 +4.25 +0.94%
Hard Red Wheat Sep 2016 474.25 +4.5 +0.96%
Hard Red Wheat Dec 2016 498.5 +4.5 +0.91%
Hard Red Wheat Mar 2017 514.5 +4 +0.78%
Hard Red Wheat May 2017 524.25 +3.5 +0.67%