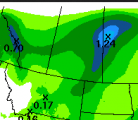
While it remains dry over much of Alberta and Saskatchewan, additional concerns in other areas are helping to keep the wheat market rising.
Spring wheat futures eked out another small gain today however canola fell about one percent on a stronger loonie, which rose along with climbing crude oil prices, and ideas that parts of the Prairies will get rain by the end of the weekend.
The canola market has a lot riding on hopes for weekend rain in Alberta and Saskatchewan. But forecasts I look at appear to be reducing the chance for widespread rain in the driest areas and shifting what there is toward the east in the Manitoba-Saskatchewan border area and perhaps the Manitoba-U.S. border area. Most western Prairie areas are expected to get only a few millimetres, not the soaker that is needed. The only place The Weather Network sees significant rain is Brandon at 15-20 mm on Saturday.
Read Also

Canadian trade data delayed by U.S. government shutdown
Canadian international trade data for September will be delayed indefinitely due to the ongoing partial shutdown of the United States government, Statistics Canada said Friday, Oct. 24.
If the dryness continues, that should continue to support canola futures.
The dry weather has also lifted feed wheat and barley prices in the Lethbridge region.
Meanwhile there could be significant rain where they don’t need it in Kansas and Oklahoma in the coming days. That could add to the concerns about disease and quality downgrades as the crop is about to be harvested.
Meanwhile farmers in France are starting to talk about dry weather and if it continues that too would provide support for wheat futures.
The U.S. Department of Agriculture issues its monthly supply and demand outlook tomorrow.
Analysts expect USDA will raise its forecasts of U.S. old- and new-crop wheat ending stocks, while trimming global ending stocks forecasts, Reuters reported.
Funds hold a massive net short position in Chicago wheat, leaving the market open to bouts of short covering.
Soybeans rose a little on the weaker U.S. dollar and on a slightly slow pace of soybean seeding in the Midwest. As of Sunday, 79 percent was in the ground compared to the five year average of 81 percent.
USDA rated 69 percent of the soybean crop as good to excellent, slightly below trade expectations and down from 74 percent a year ago.
Analysts on average expect a decline in U.S. old- and new-crop soybean ending stocks from USDA’s May report and a slight increase in world ending stocks for 2014-15, Reuters reported
USDA is also expected to raise its 2014-15 soybean production forecasts for Brazil and Argentina.
Corn dipped today on profit taking.
Analysts expect the USDA will increase domestic 2014-15 corn ending stocks.
Light crude oil nearby futures in New York were up $2 to US$60.14 per barrel.
The Canadian dollar at noon was US81.19 cents, up from 80.42 cents the previous trading day. The U.S. dollar at noon was C$1.2317.
The TSX composite rose 74.38 points of 0.50 percent to 14,817.71.
The Dow Jones industrial average fell 3.57 points, or 0.02 percent, to 17,762.98, the S&P 500 gained 0.78 points, or 0.04 percent, to 2,080.06 and the Nasdaq Composite dropped 7.76 points, or 0.15 percent, to 5,013.87.
Winnipeg ICE Futures Canada dollars per tonne
Canola Jul 2015 491.50 -5.50 -1.11%
Canola Nov 2015 489.90 -5.00 -1.01%
Canola Jan 2016 486.00 -5.50 -1.12%
Canola Mar 2016 482.70 -5.50 -1.13%
Canola May 2016 479.70 -4.50 -0.93%
Milling Wheat Jul 2015 223.00 +1.00 +0.45%
Milling Wheat Oct 2015 228.00 +1.00 +0.44%
Milling Wheat Dec 2015 228.00 +1.00 +0.44%
Durum Wheat Jul 2015 298.00 unch 0.00%
Durum Wheat Oct 2015 298.00 unch 0.00%
Durum Wheat Dec 2015 303.00 unch 0.00%
Barley Jul 2015 205.00 unch 0.00%
Barley Oct 2015 200.00 unch 0.00%
Barley Dec 2015 205.00 unch 0.00%
American crop prices in cents US/bushel, soybean meal in $US/short ton, soy oil in cents US/pound
Chicago
Soybeans Jul 2015 951.5 +7.25 +0.77%
Soybeans Aug 2015 937 +7.75 +0.83%
Soybeans Sep 2015 926.25 +5.75 +0.62%
Soybeans Nov 2015 925 +4.75 +0.52%
Soybeans Jan 2016 931.75 +4.25 +0.46%
Soybeans Mar 2016 936 +4 +0.43%
Soybean Meal Jul 2015 316.5 +7 +2.26%
Soybean Meal Aug 2015 308.4 +6.2 +2.05%
Soybean Meal Sep 2015 304.4 +5.8 +1.94%
Soybean Oil Jul 2015 33.93 -0.17 -0.50%
Soybean Oil Aug 2015 33.96 -0.17 -0.50%
Soybean Oil Sep 2015 34.01 -0.16 -0.47%
Corn Jul 2015 365 -0.25 -0.07%
Corn Sep 2015 372.5 -0.25 -0.07%
Corn Dec 2015 383 -0.5 -0.13%
Corn Mar 2016 394 -0.25 -0.06%
Corn May 2016 401.25 -0.25 -0.06%
Oats Jul 2015 257 -7.75 -2.93%
Oats Sep 2015 259.5 -10 -3.71%
Oats Dec 2015 265.5 -8.25 -3.01%
Oats Mar 2016 271.75 -9 -3.21%
Oats May 2016 278.5 -10.25 -3.55%
Wheat Jul 2015 532.25 +4.25 +0.80%
Wheat Sep 2015 538.75 +4.75 +0.89%
Wheat Dec 2015 552 +6 +1.10%
Wheat Mar 2016 564.75 +6.75 +1.21%
Wheat May 2016 572.75 +6.75 +1.19%
Minneapolis
Spring Wheat Jul 2015 582.75 +2.25 +0.39%
Spring Wheat Sep 2015 593 +2 +0.34%
Spring Wheat Dec 2015 606 +2.5 +0.41%
Spring Wheat Mar 2016 619 +2.25 +0.36%
Spring Wheat May 2016 627.75 +2 +0.32%
Kansas City
Hard Red Wheat Jul 2015 548.25 +3.75 +0.69%
Hard Red Wheat Sep 2015 559.75 +3.75 +0.67%
Hard Red Wheat Dec 2015 577.5 +4.25 +0.74%
Hard Red Wheat Mar 2016 590.75 +3.75 +0.64%
Hard Red Wheat May 2016 599.75 +3.75 +0.63%


