
A weaker Canadian dollar rode to the rescue of canola futures on Friday, offsetting the effects of a 1.4 percent drop in soybean futures.
U.S. crop futures generally fell on Friday, pressured by the rapid pace of seeding, excellent Midwest weather and the stronger U.S. dollar. U.S. markets will be closed Monday for Memorial Day. Canadian markets will be open.
Canola barely changed today.
July canola closed today at $463.20 a tonne, up 60 cents.
November closed at $454.90, down 40 cents.
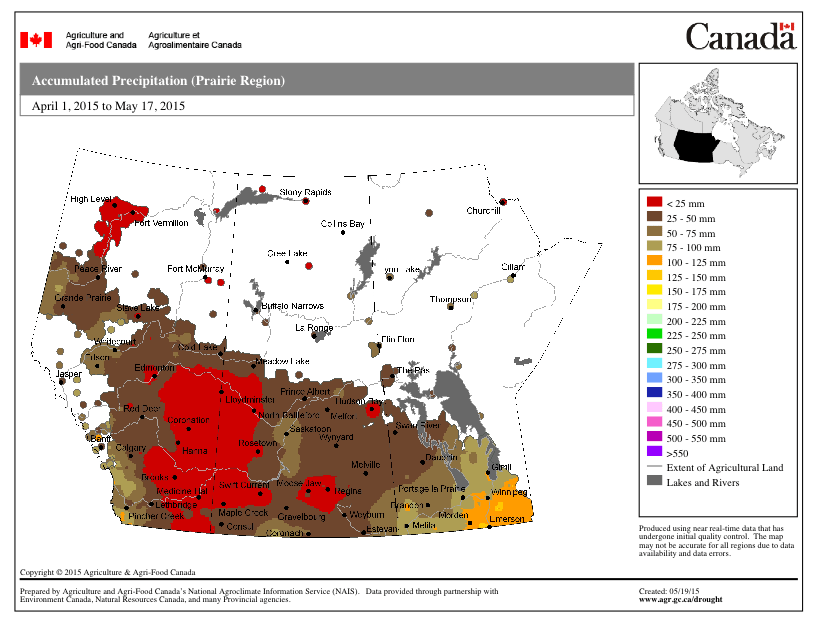
Canola is supported by expectations for tighter supplies by the end of 2015-16 and dry weather over a large part of the Western Prairies.
Click on this map to see rainfall from April 1 to May 17.
But large global supplies of soybeans are keeping a lid on canola rallies.
Over the week, July canola rose $7.90 per tonne while November rose $5.70.
Soybeans fell today as the U.S. dollar hit a three week high after Federal Reserve chair Janet Yellen was clearer than ever in a speach that the central bank is poised to raise interest rates this year,
Also U.S. soybeans are struggling to compete against the large supply of South American beans. Argentina’s government and a private Brazilian forecaster each increased soybean production forecasts on Thurday.
For the week, Chicago Board of Trade soybeans for July delivery fell three percent. July soymeal rose 0.4 percent and July soyoil fell 4.4 percent.
Read Also

B.C. ostriches culled, CFIA confirms
Ostriches on an embattled Edgewood, B.C. farm have been culled after a prolonged legal battle, the Canadian Food Inspection Agency has confirmed.
Wheat futures dipped on profit taking after rising earlier in the week on concerns about excess rain in Oklahoma and Texas. Also traders are looking for confirmation of weather damage before pushing prices any higher.
The weekly USDA crop condition report will come out on Tuesday because of the Monday holiday in the U.S.
Oklahoma State University crop marketing specialist Kim Anderson, speaking on the Radio Oklahoma Network farm report weekend edition, said the improved moisture situation will lead to a larger state crop than he expected a few weeks ago, but with the heavy rain there are concerns with lodging, along with sucker heads and how farmers will harvest a crop with two different maturity levels.
For the week, July Chicago soft wheat rose 0.7 percent, the third straight week of gains for the front-month contract, its longest stretch since December.
Kansas City hard red winter wheat was up 0.7 percent and MGEX spring wheat rose 1.3 percent this week.
In France, farm office FranceAgriMer said 91 percent of soft wheat was in good or excellent condition as of May 18, an unchanged rating from the previous week and still the highest level in five years.
Chicago Board of Trade corn futures fell 1.3 percent on Friday, as the dollar climbed, wheat fell and traders took profits on earlier gains.
Corn lost 1.4 percent for the week as plentiful existing supplies, speedy U.S. plantings and overall favourable weather conditions for the new crop continued to weigh on prices.
Light crude oil nearby futures in New York were down $1 to US$59.72 per barrel.
The Canadian dollar at noon was US81.38 cents, down from 81.96 cents the previous trading day. The U.S. dollar at noon was C$1.2288.
The TSX composite barely changed, falling 2.85 points of 0.02 percent to 15,200.76.
The Dow Jones industrial average fell 52.92 points, or 0.29 percent, to 18,232.82.
The S&P 500 lost 4.64 points, or 0.22 percent, to 2,126.18.
The Nasdaq Composite dropped 1.43 points, or 0.03 percent, to 5,089.36.
For the week, the TSX climbed 0.6 percent, the Dow was down 0.2 percent, the S&P 500 was down 0.2 percent and the Nasdaq was up 0.8 percent.
Winnipeg ICE Futures Canada dollars per tonne
Canola Jul 2015 463.20 +0.60 +0.13%
Canola Nov 2015 454.90 -0.40 -0.09%
Canola Jan 2016 454.90 -0.20 -0.04%
Canola Mar 2016 453.90 -1.20 -0.26%
Canola May 2016 452.90 -2.50 -0.55%
Milling Wheat Jul 2015 219.00 -3.00 -1.35%
Milling Wheat Oct 2015 221.00 -3.00 -1.34%
Milling Wheat Dec 2015 221.00 -3.00 -1.34%
Durum Wheat Jul 2015 298.00 unch 0.00%
Durum Wheat Oct 2015 298.00 unch 0.00%
Durum Wheat Dec 2015 303.00 unch 0.00%
Barley Jul 2015 191.00 unch 0.00%
Barley Oct 2015 177.00 unch 0.00%
Barley Dec 2015 182.00 unch 0.00%
American crop prices in cents US/bushel, soybean meal in $US/short ton, soy oil in cents US/pound
Chicago
Soybeans Jul 2015 924.25 -14.25 -1.52%
Soybeans Aug 2015 916.25 -13.5 -1.45%
Soybeans Sep 2015 907.5 -12.75 -1.39%
Soybeans Nov 2015 907 -11.5 -1.25%
Soybeans Jan 2016 914.75 -10.75 -1.16%
Soybeans Mar 2016 920.75 -10.25 -1.10%
Soybean Meal Jul 2015 304.2 +0.1 +0.03%
Soybean Meal Aug 2015 299.9 -1.1 -0.37%
Soybean Meal Sep 2015 297.1 -1.5 -0.50%
Soybean Oil Jul 2015 31.64 -0.61 -1.89%
Soybean Oil Aug 2015 31.69 -0.61 -1.89%
Soybean Oil Sep 2015 31.73 -0.59 -1.83%
Corn Jul 2015 360 -5 -1.37%
Corn Sep 2015 366.75 -4.75 -1.28%
Corn Dec 2015 377.75 -4.5 -1.18%
Corn Mar 2016 388.25 -4.5 -1.15%
Corn May 2016 395.25 -4.75 -1.19%
Oats Jul 2015 242.5 -1.75 -0.72%
Oats Sep 2015 248.25 -1.75 -0.70%
Oats Dec 2015 257 -1.5 -0.58%
Oats Mar 2016 263 -1.25 -0.47%
Oats May 2016 269.75 -1.25 -0.46%
Wheat Jul 2015 515.25 -6.75 -1.29%
Wheat Sep 2015 523 -6.5 -1.23%
Wheat Dec 2015 537 -5.5 -1.01%
Wheat Mar 2016 551.5 -4.25 -0.76%
Wheat May 2016 560.25 -3.5 -0.62%
Minneapolis
Spring Wheat Jul 2015 568.75 -9.5 -1.64%
Spring Wheat Sep 2015 580 -9.25 -1.57%
Spring Wheat Dec 2015 593.25 -9.25 -1.54%
Spring Wheat Mar 2016 605.75 -9.5 -1.54%
Spring Wheat May 2016 614.25 -7.25 -1.17%
Kansas City
Hard Red Wheat Jul 2015 546.5 -11.25 -2.02%
Hard Red Wheat Sep 2015 557 -10.75 -1.89%
Hard Red Wheat Dec 2015 573.5 -10.25 -1.76%
Hard Red Wheat Mar 2016 586.25 -9.25 -1.55%
Hard Red Wheat May 2016 594 -9 -1.49%


