As prairie farmers fearfully looked at Victoria Day weekend weather forecasts calling for sub-zero temperatures, feed grain marketers looked back on a week in which prices chilled too.
“For the guys who are holding on for a better number (on feed grain prices), I don’t know if that’s going to happen,” said Kyle Sinclair of Eisses Grain.
“It’s catching a lot of guys off-guard. We’re used to seeing everything white hot now, not declining with less and less demand.”
Unlike most years when mid-May is the middle of the seasonal feed grains rally, prices have settled back in the last few weeks as feeders have covered needs, truck deliveries haven’t been bogged down by road ban problems and early-seeded crops suggest feeders might not have to wait long for new crop supplies.
Read Also

U.S. livestock: Hog futures hit contract highs on shock herd decline
Chicago | Reuters – Lean hog futures stormed to contract highs at the Chicago Mercantile Exchange on Friday as smaller-than-expected…
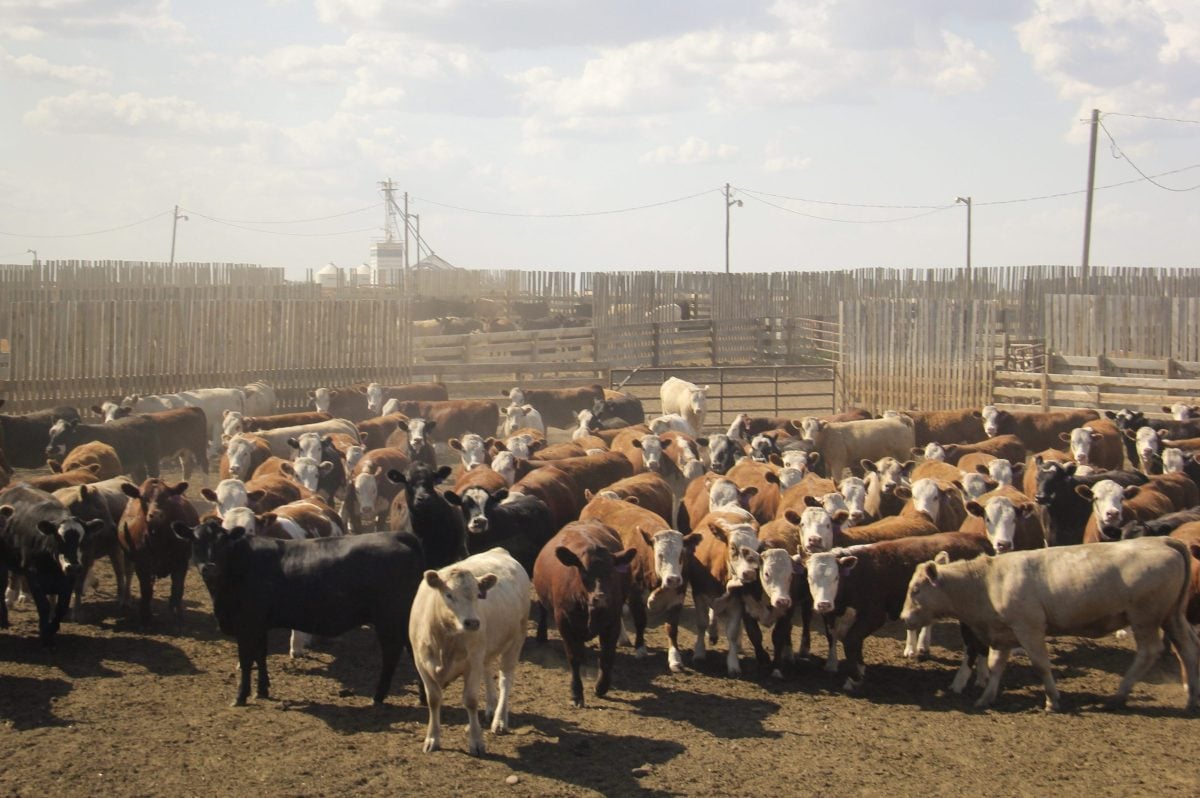
“In their minds, July is the only month that might potentially worry them,” said Sinclair of cattle feeders.
In futures markets, most crops were down a few cents on Friday, following a week of unexciting markets.
Except, of course, for Thursday’s massive rally in wheat prices, which provided an exciting interlude in the markets. Wheat contracts held most of their gains from Thursday through the Friday close. Chicago’s leading soft red winter wheat contract gained about six percent on the week.
Canola was slightly weaker on the week, following fast seeding progress on the western Prairies. Environment Canada forecasts temperatures dipping below freezing in Alberta on Sunday morning, while Saskatchewan and Manitoba are set to see temperatures as low as -4C on Monday morning..
Good weather in the U.S. Midwest soured the price outlook for soybeans. Soybeans fell about 2.4 percent over the week.
Corn was a bit stronger on the week, with some worries about frost potentially hitting early-planted crops.
Oats continued a jagged uptrend that has been in play for a couple of weeks. On Friday, oats again even as every other crop was down because, well, that’s what oats do.
Soybean crushing is surging, with the American National Oilseed Processors Association reporting the highest ever crushings for April. Soybean meal April exports were also a record for that month.
Canadian canola crushings surged over the week ending May 13, rising by 24 percent over the week before, but still only moving at less than 70 percent capacity.
So far this year canola crushing is up by almost four percent from last year at this time.
The Standard and Poor’s 500 hit yet another record Friday, and that’s a good way to head into the weekend. Hit a market record, chuck some burgers and sausages on the barbecue, open a beer and celebrate Victoria Day weekend.
Unless you’re too busy farming.
Light crude oil nearby futures in New York were down 19 cents to US$59.69 per barrel.
The Canadian dollar at noon was US83.26 cents, down from 83.39 cents the previous trading day. The U.S. dollar at noon was C$1.2010.
For the week, TSX composite fell 0.4 percent, the Dow rose 0.4 percent, the S&P rose 0.3 percent and the Nasdaq added 0.9 percent.
Winnipeg ICE Futures Canada dollars per tonne
Canola Jul 2015 455.30 -0.90 -0.20%
Canola Nov 2015 449.20 -1.00 -0.22%
Canola Jan 2016 450.00 -1.90 -0.42%
Canola Mar 2016 449.80 -1.40 -0.31%
Canola May 2016 450.30 -1.40 -0.31%
Milling Wheat Jul 2015 209.00 -1.00 -0.48%
Milling Wheat Oct 2015 213.00 -2.00 -0.93%
Milling Wheat Dec 2015 213.00 -2.00 -0.93%
Durum Wheat Jul 2015 298.00 unch 0.00%
Durum Wheat Dec 2015 303.00 unch 0.00%
Barley Jul 2015 192.00 -2.00 -1.03%
Barley Oct 2015 177.00 unch 0.00%
Barley Dec 2015 182.00 unch 0.00%
American crop prices in cents US/bushel, soybean meal in $US/short ton, soy oil in cents US/pound
Chicago
Soybeans Jul 2015 953.25 -3.75 -0.39%
Soybeans Aug 2015 946.5 -3.75 -0.39%
Soybeans Sep 2015 937 -3.25 -0.35%
Soybeans Nov 2015 934.5 -2.5 -0.27%
Soybeans Jan 2016 941.25 -2.75 -0.29%
Soybeans Mar 2016 946.75 -2.5 -0.26%
Soybean Meal Jul 2015 303.3 +1.1 +0.36%
Soybean Meal Aug 2015 301.2 +0.5 +0.17%
Soybean Meal Sep 2015 299.5 +0.6 +0.20%
Soybean Oil Jul 2015 33.07 -0.27 -0.81%
Soybean Oil Aug 2015 33.12 -0.25 -0.75%
Soybean Oil Sep 2015 33.16 -0.24 -0.72%
Corn Jul 2015 365.5 -2.5 -0.68%
Corn Sep 2015 372.5 -2 -0.53%
Corn Dec 2015 382.75 -2 -0.52%
Corn Mar 2016 393.5 -2 -0.51%
Corn May 2016 400.75 -2.25 -0.56%
Oats Jul 2015 248.5 +1 +0.40%
Oats Sep 2015 253.75 +0.25 +0.10%
Oats Dec 2015 262.5 unch 0.00%
Oats May 2016 275.25 -0.25 -0.09%
Wheat Jul 2015 511 -3.25 -0.63%
Wheat Sep 2015 517.5 -3.5 -0.67%
Wheat Dec 2015 532 -4.25 -0.79%
Wheat Mar 2016 546.25 -5 -0.91%
Wheat May 2016 555.75 -5.75 -1.02%
Minneapolis
Spring Wheat Jul 2015 561.25 -5.25 -0.93%
Spring Wheat Sep 2015 572.75 -4.75 -0.82%
Spring Wheat Dec 2015 587.25 -5 -0.84%
Spring Wheat Mar 2016 600.25 -6.25 -1.03%
Spring Wheat May 2016 609.25 -6 -0.98%
Kansas City
Hard Red Wheat Jul 2015 541.75 -1.5 -0.28%
Hard Red Wheat Sep 2015 551.25 -1.75 -0.32%
Hard Red Wheat Dec 2015 567.75 +0.5 +0.09%
Hard Red Wheat Mar 2016 580 +0.5 +0.09%
Hard Red Wheat May 2016 587.75 unch 0.00%


