Monday broke the recent dullness in the crop markets with a big up day for canola and soybean oil, but the reason was hard to figure out.
“It was a handful of things,” said analyst Jon Driedger of FarmLink Marketing about the more than three percent gain for soybean oil and the nearly two-and-a-half percent gain for canola.
“It was just sort of a combination of multiple things that came together and gave it a bit of a rambunctious day.”
Chinese buying of soybean oil from Argentina, worries about Argentine port problems, and recent technical strength in soybean oil were noted by some as triggers that helped shoot soybean oil higher.
Read Also

U.S. livestock: Hog futures hit contract highs on shock herd decline
Chicago | Reuters – Lean hog futures stormed to contract highs at the Chicago Mercantile Exchange on Friday as smaller-than-expected…
For six weeks soybean oil has been in a gentle uptrend, but Monday saw it shoot to the upper extreme of the rising channel.
Canola rose despite a stronger loonie, highlighting the crop’s strength in an oil-driven market. Soybeans fared well Monday too, but rose more slowly than canola.
While canola is almost 50 percent oil in terms of weight, soybeans are only about 20 percent oil, so an oil rally can only carry soybeans along so far.
Decent rains kissed most U.S. wheat regions during the weekend, so buyers relaxed a little about those crops and prices eased off a few cents in wheat futures contracts.
Corn and oats were slightly off too.
Most crop contracts continue to tread water in this limbo period between seeding and emergence in many areas. Crops are getting sown, conditions are good, but there’ s not much to look at yet.
Stock markets were higher Monday, taking indexes back to record level territory again, after some sharp sell-offs last week.
The royal baby was named. The new princess is Charlotte Elizabeth Diana, a nicely balanced name with references to both grandmother and great-grandmother.
Light crude oil nearby futures in New York were down 22 cents to US$58.93 per barrel.
The Canadian dollar at noon was US82.57 cents, up from 82.02 cents the previous trading day. The U.S. dollar at noon was C$1.2111.
Toronto Stock Exchange’s S&P/TSX composite index closed up 27.7 points, or 0.18 percent, at 15,367.47.
The Dow Jones industrial average rose 46.34 points, or 0.26 percent, to end at 18,070.4, and the S&P 500 gained 6.2 points, or 0.29 percent, to 2,114.49. The Nasdaq Composite added 11.54 points, or 0.23 percent, to 5,016.93.
Winnipeg ICE Futures Canada dollars per tonne
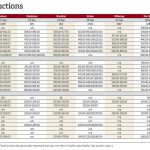
Canola May 2015 470.80 +10.90 +2.37%
Canola Jul 2015 457.30 +10.10 +2.26%
Canola Nov 2015 448.90 +9.10 +2.07%
Canola Jan 2016 450.20 +9.20 +2.09%
Canola Mar 2016 450.10 +9.00 +2.04%
Milling Wheat May 2015 195.00 -2.00 -1.02%
Milling Wheat Jul 2015 198.00 -1.00 -0.50%
Milling Wheat Oct 2015 204.00 -1.00 -0.49%
Durum Wheat May 2015 313.00 unch 0.00%
Durum Wheat Jul 2015 303.00 unch 0.00%
Durum Wheat Oct 2015 308.00 unch 0.00%
Barley May 2015 200.00 -5.00 -2.44%
Barley Jul 2015 202.00 -5.00 -2.42%
Barley Oct 2015 187.00 -5.00 -2.60%
American crop prices in cents US/bushel, soybean meal in $US/short ton, soy oil in cents US/pound
Chicago
Soybeans May 2015 983 +14.5 +1.50%
Soybeans Jul 2015 976.25 +11.5 +1.19%
Soybeans Aug 2015 969.5 +10.5 +1.09%
Soybeans Sep 2015 956.25 +9.5 +1.00%
Soybeans Nov 2015 949 +8.25 +0.88%
Soybeans Jan 2016 955.25 +8.25 +0.87%
Soybean Meal May 2015 315.8 +1.1 +0.35%
Soybean Meal Jul 2015 313 +1.1 +0.35%
Soybean Meal Aug 2015 310.9 +0.5 +0.16%
Soybean Oil May 2015 32.47 +1.03 +3.28%
Soybean Oil Jul 2015 32.63 +1.05 +3.32%
Soybean Oil Aug 2015 32.65 +1.03 +3.26%
Corn May 2015 358.75 -1 -0.28%
Corn Sep 2015 367.75 -2 -0.54%
Corn Dec 2015 377.75 -2.5 -0.66%
Corn Mar 2016 389 -2.5 -0.64%
Oats May 2015 229.25 +0.25 +0.11%
Oats Jul 2015 232 -4 -1.69%
Oats Sep 2015 239 -3 -1.24%
Oats Dec 2015 247 -3.75 -1.50%
Oats Mar 2016 256.25 -4.5 -1.73%
Wheat May 2015 469.25 -0.75 -0.16%
Wheat Jul 2015 472.75 -1.25 -0.26%
Wheat Sep 2015 481.25 -1.5 -0.31%
Wheat Dec 2015 498.25 -2.5 -0.50%
Wheat Mar 2016 515.25 -2.75 -0.53%
Minneapolis
Spring Wheat May 2015 516 -4.25 -0.82%
Spring Wheat Jul 2015 530.25 -4.25 -0.80%
Spring Wheat Sep 2015 541 -4 -0.73%
Spring Wheat Dec 2015 554.75 -3 -0.54%
Spring Wheat Mar 2016 570.25 -2.25 -0.39%
Kansas City
Hard Red Wheat May 2015 493.75 +0.5 +0.10%
Hard Red Wheat Jul 2015 498.25 -2.25 -0.45%
Hard Red Wheat Sep 2015 508 -2.5 -0.49%
Hard Red Wheat Dec 2015 527.5 -2.5 -0.47%
Hard Red Wheat Mar 2016 541 -2.25 -0.41%


