The effects of a weaker loonie and strong U.S. soybean and meal exports were not enough to drive canola futures higher Thursday.
It was the first daily loss since Oct. 17. Between the close Oct. 15 and the close Oct. 23 November canola had gained $16 per tonne.
Although the weaker currency and strong exports lead to slight gains in oilseeds early in the day, the desire to take profits after recent run ups dominated later trading.
A pick up in farmer selling and associated commercial hedging also weighed on canola.
Read Also
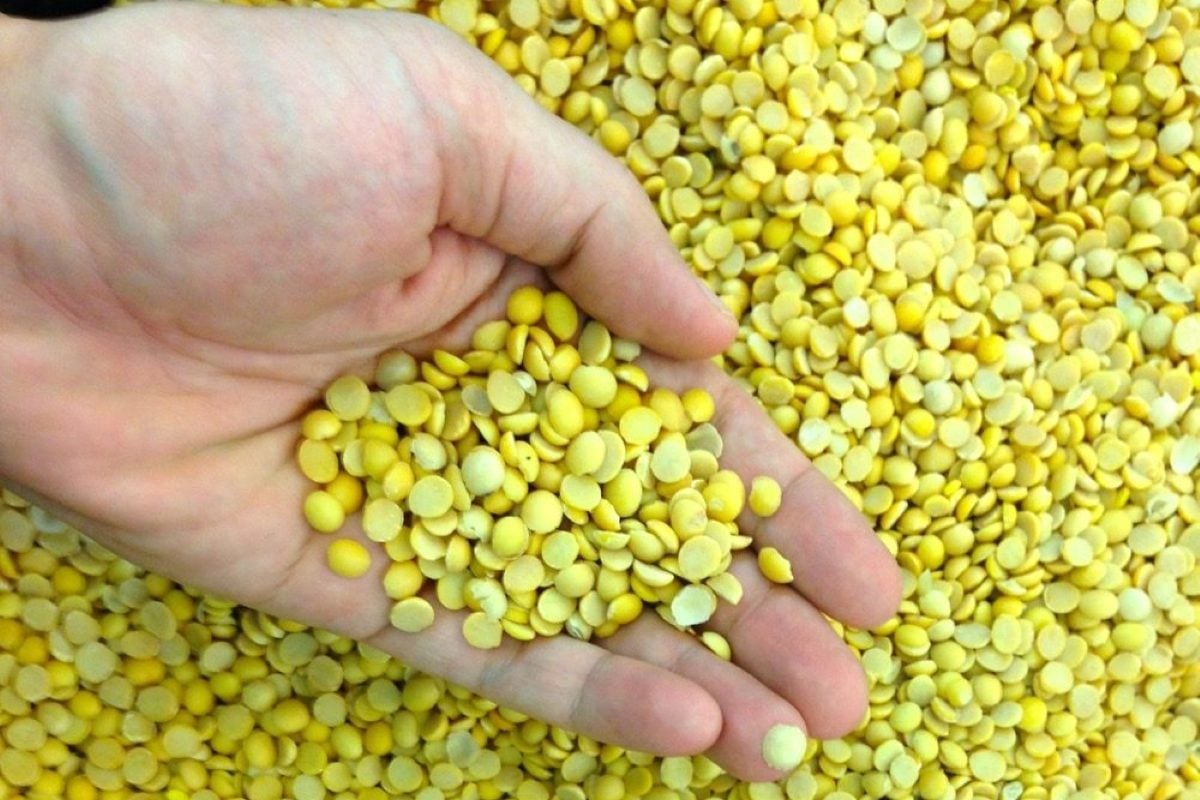
Pulse Weekly: India imposes 30 per cent tariff on yellow peas
Pulse Canada is quite unhappy with the Indian government’s recent move to slap a 30 per cent tariff on its yellow pea imports, said the pulse organization’s board chair Terry Youzwa.
While demand appears to be good, the market can’t ignore the huge crops harvested in Canada and the United States.
Analysts also expect record large soybean seeding in South America.
Saskatchewan Agriculture said the harvest in the province was 99 percent complete. It estimated the average canola yield at 38 bushels per acre. That is well above the current Statistics Canada forecast for 35.2 for Saskatchewan. The five-year average (2008-12) is 31.5 bu. per acre.
Both the Canadian and U.S. dollar are falling. The loonie is down following Bank of Canada statements Wednesday that it no longer expects to increase interest rates in the near term. It sees inflation remaining at less than its two percent target until the end of 2015. In July it expected to reach the target at the midpoint of 2015.
The U.S. buck is down against the euro on lower U.S. bond yields and expectations the Federal Reserve will maintain its bond-buying stimulus program well into next year.
The strong U.S. crop export data released today was for the week ending Oct. 3.
Next Thursday, USDA will release export data for the three weeks ending Oct. 10, Oct. 17 and Oct 24.
Advisory service FarmLink Marketing of Winnipeg issued forecasts for 2014 Cdn seeding. It expects a shift from spring wheat, with acreage down 7.9 percent, to canola, with acreage up 11.7 percent compared to this past spring.
It also sees barley area down 2.3 percent, durum down four percent and oats down 6.4 percent.
Peas and lentils are little changed.
FarmLink Marketing said its forecast was based on its analysis of supply and demand to the end of 2013-14, price projections for the 2014-15 crop year, the market signals and production economics in western Canada.
Canadian Grain Commission figures for the first two months of the crop year (Aug-Sept) show Canadian wheat exports totaling 2.458 million tonnes vs. 2.368 million at he same time last year.
Canola exports were 706,300 tonnes, down from 1.118 million last year. That reflects the later harvest and lack of old crop supply pre harvest.
Canada is getting some China wheat business. In the first two months wheat exports to China totaled 204,000 tonnes, up from 57,800 last year in the same period.
The top buyer of Canadian wheat in the first two months of the crop year was Indonesia at 319,600 tonnes. In second place was the United States at 276,300. Mexico was in third place at 270,300 tonnes. China was in fourth place and right behind in fifth place was Japan at 203,400 tonnes. (I made a mistake yesterday when I tweeted Japan was in fourth place.)
ICE Futures Canada, dollars per tonne
Canola Nov 2013 489.10 -4.30 -0.87%
Canola Jan 2014 500.00 -3.80 -0.75%
Canola Mar 2014 508.70 -3.60 -0.70%
Canola May 2014 515.60 -3.70 -0.71%
Canola Jul 2014 521.30 -3.30 -0.63%
Milling Wheat Dec 2013 236.00 -2.00 -0.84%
Milling Wheat Mar 2014 242.00 -2.00 -0.82%
Milling Wheat May 2014 247.00 -1.00 -0.40%
Durum Wheat Dec 2013 247.00 unch 0.00%
Durum Wheat Mar 2014 253.00 unch 0.00%
Durum Wheat May 2014 257.00 unch 0.00%
Barley Dec 2013 152.00 unch 0.00%
Barley Mar 2014 154.00 unch 0.00%
Barley May 2014 155.00 unch 0.00%
American crop prices in cents US/bushel, soybean meal in $US/short ton, soy oil in cents US/pound
Chicago
Soybeans Nov 2013 1309.75 -0.25 -0.02%
Soybeans Jan 2014 1303.75 -0.25 -0.02%
Soybeans Mar 2014 1282 -1.5 -0.12%
Soybeans May 2014 1264.5 -1.75 -0.14%
Soybeans Jul 2014 1259.5 -2.75 -0.22%
Soybeans Aug 2014 1246.75 -3.25 -0.26%
Soybean Meal Dec 2013 426 +4.6 +1.09%
Soybean Meal Jan 2014 415.9 +2.7 +0.65%
Soybean Meal Mar 2014 402.5 +1.6 +0.40%
Soybean Oil Dec 2013 41.13 -0.37 -0.89%
Soybean Oil Jan 2014 41.43 -0.37 -0.89%
Soybean Oil Mar 2014 41.8 -0.38 -0.90%
Corn Dec 2013 440.25 -2.5 -0.56%
Corn Mar 2014 452.5 -2.75 -0.60%
Corn May 2014 461 -2.75 -0.59%
Corn Jul 2014 468.75 -2.5 -0.53%
Corn Sep 2014 475.25 -2.25 -0.47%
Oats Dec 2013 344.25 -0.25 -0.07%
Oats Mar 2014 320.75 +2.25 +0.71%
Oats May 2014 319.75 +2.25 +0.71%
Oats Jul 2014 320.25 +1.25 +0.39%
Oats Sep 2014 319.25 +1.25 +0.39%
Wheat Dec 2013 696.5 -5.25 -0.75%
Wheat Mar 2014 707 -4.5 -0.63%
Wheat May 2014 712.25 -2.75 -0.38%
Wheat Jul 2014 704 +0.25 +0.04%
Wheat Sep 2014 709.5 unch 0.00%
Minneapolis
Spring Wheat Dec 2013 752 -6.75 -0.89%
Spring Wheat Mar 2014 762.25 -6.25 -0.81%
Spring Wheat May 2014 767 -6 -0.78%
Spring Wheat Jul 2014 768 -4.5 -0.58%
Spring Wheat Sep 2014 763 -3.5 -0.46%
Kansas City
KCBT Red Wheat Dec 2013 764.25 -6.5 -0.84%
KCBT Red Wheat Mar 2014 763.5 -6 -0.78%
KCBT Red Wheat May 2014 759.75 -6.25 -0.82%
KCBT Red Wheat Jul 2014 743.75 -2 -0.27%
KCBT Red Wheat Sep 2014 747.75 -2.75 -0.37%
Light crude oil nearby futures in New York rose 25 cents at $97.11 US per barrel.
The Bank of Canada noon rate for the loonie was 95.95 cents US, down from 96.29 cents the previous trading day. The U.S. dollar at noon was $1.0422 Cdn.
The prospect for continuing U.S. Federal Reserve stimulus and solid quarterly earnings reports lifted stocks.
The Toronto Stock Exchange’s S&P/TSX composite index closed up 81.43 points, or 0.61 percent, at 13,324.75, extending a strong two-week run that has the index at its highest level in more than two years.
The Dow Jones industrial average was up 95.23 points, or 0.62 percent, at 15,508.56.
The Standard & Poor’s 500 Index was up 5.63 points, or 0.32 percent, at 1,752.01.
The Nasdaq Composite Index was up 21.89 points, or 0.56 percent, at 3,928.96.