
Profit taking after the recent run up in grain prices knocked grain markets lower on Tuesday.
Canola fell harder than soybeans, as weather in Canada is more conducive to good crop development than in the U.S., where heat and lack of rain are expected to stress soybean though August. Despite the stress, analysts still expect bumper crops in the U.S.
November canola closed at $508.10, down $9.70 or 1.87 percent. November beans were down about one percent.
Statistics Canada reports on the expected size of Canadian crops tomorrow. The trade anticipates a record-large 15.5 million tonne canola crop in 2013-14.
Read Also

U.S. grains: Soybeans rise on China demand hopes; corn and wheat rebound
Chicago Board of Trade soybean, corn and wheat futures rose on Monday on signs of progress towards the end of a record-long U.S. government shutdown, along with expectations of a revival of U.S. soybean exports to China, analysts said.
Watch for our coverage at Producer.com and at our Twitter feeds at darcemcmillan and westernproducer.
Scouts on the annual Pro Farmer Midwest Crop Tour reported generally excellent yield potential in the eastern and western edges of the corn belt. They head into the central heartland of the Midwest in Iowa later this week. Final numrs will be released Friday afternoon.
ICE Futures Canada reports the best canola basis yesterday was $13 over the November contract.
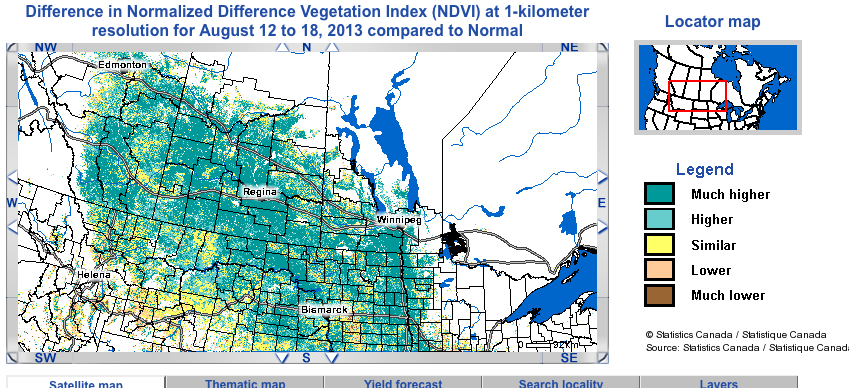
The Statistics Canada crop condition assessment program, that uses satellite vegetation imaging, shows crop conditions in Canada are generally better than normal.

Drew Lerner of World Weather Inc. says there is a potential of frost in Western Canada in the first week to 10 days of September, with another chance in the last week of September.
Winnipeg ICE Futures Canada dollars per tonne
Canola Nov 2013 508.10 -9.70 -1.87%
Canola Jan 2014 513.30 -9.80 -1.87%
Canola Mar 2014 518.60 -9.80 -1.85%
Canola May 2014 523.20 -9.70 -1.82%
Canola Jul 2014 527.70 -9.70 -1.80%
Milling Wheat Oct 2013 252.00 -3.00 -1.18%
Milling Wheat Dec 2013 257.00 -2.00 -0.77%
Milling Wheat Mar 2014 262.00 -2.00 -0.76%
Durum Wheat Oct 2013 289.00 unch 0.00%
Durum Wheat Dec 2013 294.00 unch 0.00%
Durum Wheat Mar 2014 304.00 unch 0.00%
Barley Oct 2013 189.00 unch 0.00%
Barley Dec 2013 194.00 unch 0.00%
Barley Mar 2014 194.00 unch 0.00%
American crop prices in cents US/bushel, soybean meal in $US/short ton, soy oil in cents US/pound
Chicago
Soybeans Sep 2013 1309.25 -12.75 -0.96%
Soybeans Nov 2013 1290.5 -12.75 -0.98%
Soybeans Jan 2014 1291.75 -12 -0.92%
Soybeans Mar 2014 1271 -8 -0.63%
Soybeans May 2014 1245.5 -5.5 -0.44%
Soybeans Jul 2014 1244.75 -6.25 -0.50%
Soybean Meal Sep 2013 413.8 -6.5 -1.55%
Soybean Meal Oct 2013 404.8 -2.8 -0.69%
Soybean Meal Dec 2013 402 -2.2 -0.54%
Soybean Oil Sep 2013 42.88 -0.57 -1.31%
Soybean Oil Oct 2013 42.94 -0.57 -1.31%
Soybean Oil Dec 2013 43.18 -0.6 -1.37%
Corn Sep 2013 483.75 -9.5 -1.93%
Corn Dec 2013 475.5 -10 -2.06%
Corn Mar 2014 488.5 -9.25 -1.86%
Corn May 2014 496.5 -9 -1.78%
Corn Jul 2014 502.25 -8.5 -1.66%
Oats Sep 2013 382.25 -2.5 -0.65%
Oats Dec 2013 334.25 -2 -0.59%
Oats Mar 2014 337.5 -2 -0.59%
Oats May 2014 337.5 -2.5 -0.74%
Oats Jul 2014 341.75 -2.5 -0.73%
Wheat Sep 2013 634.25 -7.25 -1.13%
Wheat Dec 2013 646 -7.5 -1.15%
Wheat Mar 2014 657.5 -8.75 -1.31%
Wheat May 2014 664 -8.75 -1.30%
Wheat Jul 2014 661.75 -7.25 -1.08%
Minneapolis
Spring Wheat Sep 2013 735 -10.25 -1.38%
Spring Wheat Dec 2013 739 -6.5 -0.87%
Spring Wheat Mar 2014 750 -6.5 -0.86%
Spring Wheat May 2014 756.5 -5.25 -0.69%
Spring Wheat Jul 2014 759.25 -5.25 -0.69%
Kansas City
KCBT Red Wheat Sep 2013 696.75 -6.5 -0.92%
KCBT Red Wheat Dec 2013 699.25 -8 -1.13%
KCBT Red Wheat Mar 2014 706.75 -7 -0.98%
KCBT Red Wheat May 2014 710.5 -7 -0.98%
KCBT Red Wheat Jul 2014 700.75 -6.5 -0.92%
Light crude oil nearby futures in New York dropped $2.14 at $104.96 US per barrel.
The Canadian dollar at noon was 96.38 cents US, down from 96.77 cents the previous trading day. The U.S. dollar at noon was $1.0
At the Toronto Stock Exchange gains in financial and resource shares offset concerns about the fate of the U.S. Federal Reserve’s stimulus program.
The S&P/TSX composite index closed up 82.09 points, or 0.65 percent, at 12,670.11.
An earlier version of this story had incorrect closing U.S. stock index data. It should be the following: The Dow Jones industrial average fell 7.75 points or 0.05 percent, to 15,002.99, the S&P 500 gained 6.29 points or 0.38 percent, to 1,652.35 and the Nasdaq Composite added 24.504 points or 0.68 percent, to 3,613.59.


