Canola futures rose Thursday on the buying back of previously sold contracts and on late session demand from commercial users.
Gains were limited by a more than half-cent rise in the loonie.
US crop futures were mostly lower on slow demand and weaker basis, but concerns about wet weather slowing seeding progress limited the losses in new crop.
New crop Minneapolis wheat eked out a gain but Chicago wheat was down on worries that the discovery of an unregistered GMO glyphosate resistant variety growing in Oregon could hurt demand. Japan has halted imported of U.S western white wheat, the class of wheat affected by the GMO contamination.
Read Also

Pulse Weekly: Talk arises of India ending duty-free period
With harvest underway across the Canadian Prairies rumblings has been felt from the other side of the world, specifically in regards yellow peas. There have been recent media reports stating the Indian government is under growing domestic pressure to end its duty-free period on yellow pea imports.
The European Union said it would test incoming shipments of U.S. wheat for GM content.
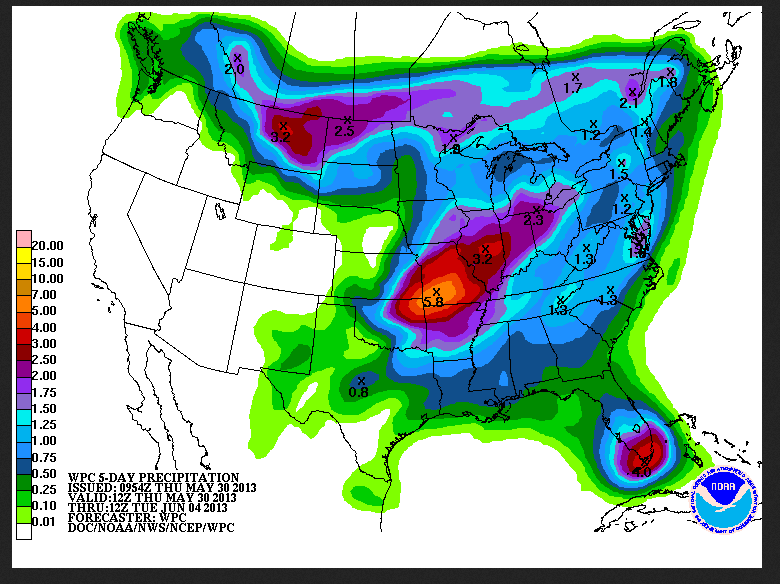
The southern Canadian Prairies are expected to get rain today and overnight. Another rain event is expected Monday. Parts of Missouri and Illinois are expected to get three to five inches over the period.
Saskatchewan Agriculture today said that as of May 27 farmers have almost caught up to the five-year average for seeding progress.
About 67 percent of the crop is in the ground compared to the five-year average of 70 percent. Progress is most advanced in the southwest with 85 percent done and slowest in the northeast where about half is seeded.
Outside markets continued to ebb and flow based on changing expectations of what the U.S. Federal Reserve will do about its simulative policy. A surprise rise in the weekly number of first time claims for unemployment benefits in the U.S. led some to think that the Fed will continue its policy and that support stock prices.
Winnipeg ICE Futures Canada (Cdn $ per tonne)
Canola Jul 2013 645.50 +5.00 +0.78%
Canola Nov 2013 573.70 +3.60 +0.63%
Canola Jan 2014 574.90 +2.90 +0.51%
Canola Mar 2014 569.20 +3.10 +0.55%
Canola May 2014 561.00 +2.40 +0.43%
Milling Wheat Jul 2013 294.00 unch 0.00%
Milling Wheat Oct 2013 294.00 unch 0.00%
Milling Wheat Dec 2013 294.00 unch 0.00%
Durum Wheat Jul 2013 301.90 unch 0.00%
Durum Wheat Oct 2013 294.90 unch 0.00%
Durum Wheat Dec 2013 299.40 unch 0.00%
Barley Jul 2013 244.00 unch 0.00%
Barley Oct 2013 194.00 unch 0.00%
Barley Dec 2013 199.00 unch 0.00%
U.S. crops in ¢US per bushel, soy meal in $US per short ton, soy oil in ¢US per pound
Chicago
Soybeans Jul 2013 1495.75 -6 -0.40%
Soybeans Aug 2013 1426.75 -2.5 -0.17%
Soybeans Sep 2013 1334.25 +2.75 +0.21%
Soybeans Nov 2013 1289.25 +0.75 +0.06%
Soybeans Jan 2014 1294.5 -0.25 -0.02%
Soybeans Mar 2014 1295 -0.25 -0.02%
Soybean Meal Jul 2013 440.8 -3.5 -0.79%
Soybean Meal Aug 2013 420.3 -1.6 -0.38%
Soybean Meal Sep 2013 399.4 -0.2 -0.05%
Soybean Oil Jul 2013 48.58 -0.05 -0.10%
Soybean Oil Aug 2013 48.57 -0.06 -0.12%
Soybean Oil Sep 2013 48.44 -0.05 -0.10%
Corn Jul 2013 654.25 -10.75 -1.62%
Corn Sep 2013 591.75 -2 -0.34%
Corn Dec 2013 562.75 -3 -0.53%
Corn Mar 2014 572.75 -3 -0.52%
Corn May 2014 579.5 -3 -0.52%
Oats Jul 2013 368 +5 +1.38%
Oats Sep 2013 366 +9 +2.52%
Oats Dec 2013 359 +2.5 +0.70%
Oats Mar 2014 363 +1.25 +0.35%
Oats May 2014 365.25 +1.25 +0.34%
Wheat Jul 2013 698.75 -4 -0.57%
Wheat Sep 2013 708 -3.25 -0.46%
Wheat Dec 2013 723.5 -3.75 -0.52%
Wheat Mar 2014 738.75 -3.75 -0.51%
Wheat May 2014 748 -3.75 -0.50%
Spring Wheat Jul 2013 815.5 -0.25 -0.03%
Spring Wheat Sep 2013 805.25 +0.25 +0.03%
Spring Wheat Dec 2013 812.75 +1.25 +0.15%
Spring Wheat Mar 2014 825 +0.75 +0.09%
Spring Wheat May 2014 831.25 +2 +0.24%
KCBT Red Wheat Jul 2013 746 -1.75 -0.23%
KCBT Red Wheat Sep 2013 755.25 -1 -0.13%
KCBT Red Wheat Dec 2013 774 -0.5 -0.06%
KCBT Red Wheat Mar 2014 787.5 -0.25 -0.03%
KCBT Red Wheat May 2014 794.25 -0.25 -0.03%
The Bank of Canada noon rate for the loonie was 97.00 cents US, up from 96.46 cents the day before.
Crude oil in New York was up 48 cents at $93.61 US per barrel.
In early, unofficial tallies —
The Toronto Stock Exchange’s S&P/TSX composite index rose 13.94 points, or 0.11 percent, at 12,746.55.
The Dow Jones industrial average was up 23.26 points, or 0.15 percent, at 15,326.06.
The Standard & Poor’s 500 Index was up 6.16 points, or 0.37 percent, at 1,654.52.
The Nasdaq Composite Index was up 23.78 points, or 0.69 percent, at 3,491.30.