
Canola dipped in thin trade Tuesday pressured by falling soybeans.
There is a bit of stalemate between farmers who won’t deliver until they see higher prices and users who think prices are already expensive.
Soybeans were under a little pressure from the rapid pace of harvest in Brazil, although the fall was limited by the South American’s country’s problems with infrastructure limits and port congestion.
Most traded May canola closed at $624.70, down $3.60. New crop November closed at $557.20, down $2.80.
Ukraine, which exports mostly to Europe, is expected to have a rapeseed harvest of just over two million tonnes, up from 1.2 million last year.
Read Also
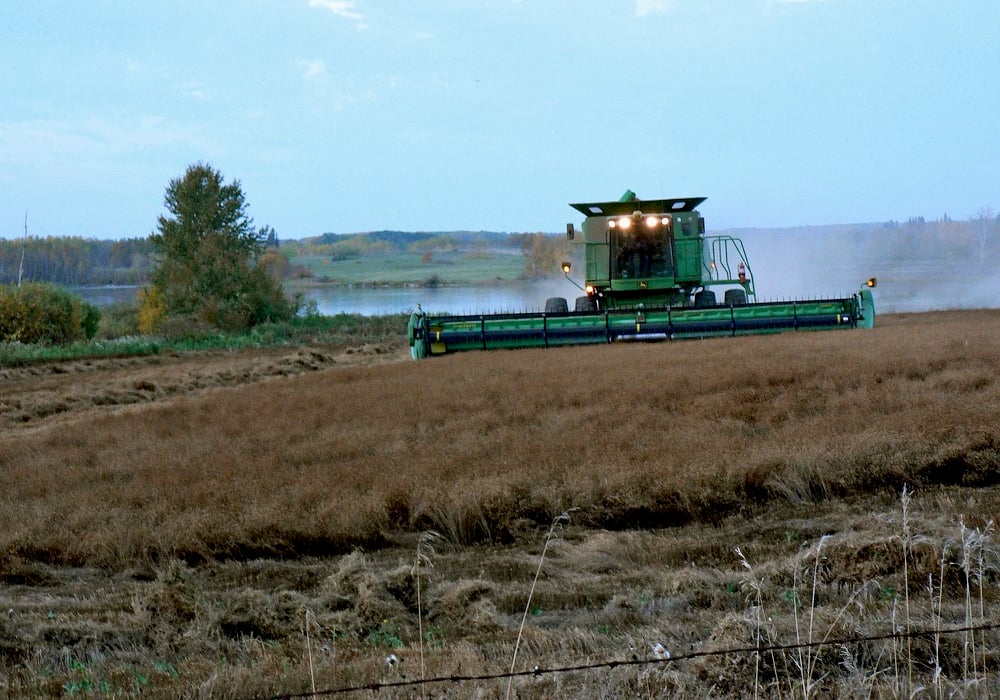
Most of Manitoba harvest wraps up for 2025
Manitoba Agriculture issued its final crop report of 2025, showing the overall provincewide harvest at 97 per cent complete as of Oct. 20. Nearly all major crops have finished combining, with 37 per cent of Manitoba’s sunflowers finished, plus 71 per cent of grain corn and small amounts of soybeans and potatoes left to do.
Favourable weather allowed winter rapeseed to come through winter without the kind of losses experienced last year, said analyst UkrAgroConsult in a report.
Last year it lost 52 percent of the crop to winter kill. This year the loss is expected to be eight percent.
It also hopes to expand other oilseeds.
Based on average weather, its sunflower seed crop could climb to 9.5 million tonnes, an increase of 11 percent. Better yields would more than offset a drop in seeded area, down to 13.1 million acres from 14.1 million last year.
Also soybean production to rise to 2.7 million tonnes from 2.3 million last year, UkrAgroConsult.
The U.S. ag attache in Bejing forcasts China’s 2013-14 rapeseed crop will rise to 12.7 million tonnes from 12.5 million last year.
That is based on a slight increase in seeded area and steady yields.
Underused crush capacity is expected to boost the demand for rapeseed imports to three million tonnes for 2013-14, up from an estimated 2.85 million in 2012-13.
Australia, shich has not been able to export to China because of blackleg, might soon get access similar to Canada’s.
The attache forecasts soybean production at 12 milion tonnes, down 500,000 from 2012-13.
Soybean imports are forecast at 65.5 million tonnes, up 2.5 million or four percent from the estimated 63million in 2012-13.
Corn edged higher today on technical and speculative demand fed by worries about tight supply of U.S. supply. Supply is expected to be particularly tight in May and June .
The Canola Council of Canada holds its annual meeting in Vancouver later this week.
Closing prices
Winnipeg ICE Futures Canada (dollars per tonne)
Canola Mar 13 $639.70 +$3.40 +0.53%
Canola May 13 $624.70 -$3.60 -0.57%
Canola Jul 13 $612.20 -$4.20 -0.68%
Canola Nov 13 $557.20 -$2.80 -0.50%
Milling Wheat Mar 13 $289, unchanged
Milling Wheat May 13 $292, unchanged
Milling Wheat Jul 13 $294, unchanged
Milling Wheat Oct 13 $294, unchanged
Durum Wheat Mar 13 $307, unchanged
Durum Wheat May 13 $311, unchanged
Durum Wheat Jul 13 $314, unchanged
Durum Wheat Oct 13 $299.30, unchanged
Barley Mar 13 $242, unchanged
Barley May 13 $243, unchanged
Barley Jul 13 $243.50, unchanged
Barley Oct 13 $243.50, unchanged
U.S. markets in cents per bushel
Chicago
Soybeans (P) Mar 13 1489.75 -25.0 -1.65%
Soybeans (P) May 13 1468.75 -10.75 -0.73%
Soybeans (P) Jul 13 1445.75 -9.0 -0.62%
Soybeans (P) Aug 13 1399 -8.25 -0.59%
Soybeans (P) Sep 13 1319.75 -2.75 -0.21%
Soybeans (P) Nov 13 1269.5 -0.5 -0.04%
Corn (P) Mar 13 741 +6.5 +0.88%
Corn (P) May 13 714.25 +3.0 +0.42%
Corn (P) Jul 13 693.75 +3.0 +0.43%
Corn (P) Sep 13 582 +3.25 +0.56%
Corn (P) Dec 13 557.25 +2.5 +0.45%
Oats (P) Mar 13 425 +2.0 +0.47%
Oats (P) May 13 394 +1.0 +0.25%
Oats (P) Jul 13 382, unchanged
Oats (P) Sep 13 371.75, unchanged
Oats (P) Dec 13 367.75 +1.75 +0.48%
Minneapolis
Spring Wheat Mar 13 800.75 -10.25 -1.26%
Spring Wheat May 13 791.5 -2.5 -0.31%
Spring Wheat Jul 13 789 -2.0 -0.25%
Spring Wheat Sep 13 788.5 -3.5 -0.44%
Spring Wheat Dec 13 795.5 -2.75 -0.34%
The Bank of Canada noon rate for the loonie was 97.52 cents US, up from 97.39 on Monday. The U.S. buck was $1.0254 Cdn.
Light crude oil in New York rose 48 cent to $92.54 per barrel.
The Toronto Stock Exchange’s S&P/TSX composite index rose 30.91 points, or 0.24 percent, at 12,889.40. It earlier reached 12,904.71, its highest since August 2011, lifted by higher gold company stocks.
The Dow Jones industrial average edged up 2.77 points, or 0.02 percent, to close at 14,450.06.
The S&P 500 ended seven straight days of increases.
The Standard & Poor’s 500 Index slipped 3.74 points, or 0.24 percent, to 1,552.48.
The Nasdaq Composite Index fell 10.55 points, or 0.32 percent, to close at 3,242.32.


