A network of more than 370 weather stations, generating hourly weather up-dates, makes Alberta Agriculture’s weatherdata.ca one of the most detailed weather websites in Canada.
“This is the weather watchers’ website,” said Ralph Wright, manager of the provincial department’s agriculture meteorology section.
At the AgroClimatic Information Service site, commonly called ACIS, and visitors can click on a link and a visitor to the site can watch a storm cell tracking over a specific quarter section.
Click on another link and find the temperature, wind and precipitation at any location.
Read Also

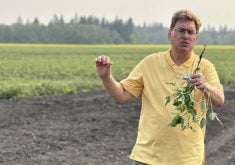
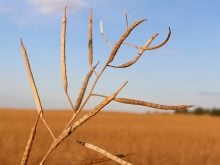
Soybeans, peas flag under drought conditions
Manitoba’s pea and soybean acres are suffering in drought-stricken regions like the Interlake. Dry conditions are stressing crops, fuelling pest pressure and slicing yield potential.
Or, browse through the website to see any one of the 20,000 weather maps dating back to 1961.
“You can go to any month in a 56-year period. No one has got anything like this,” said Wright.
Alberta Agriculture staff developed the website after a drought in 2002 as part of a drought management plan.
Two years later, Agriculture Financial Service Corp. (AFSC) contributed money for more weather stations to allow it to design a better crop insurance program based on weather.
“It was a happy coincidence of a project supported by management and staff that had the ability to build a detailed weather website and install the stations,” said Wright.
“It just happened spontaneously over a decade.”
The number of meteorological stations has increased dramatically in the last decade from the department’s original 36.
Many of the stations are located on Alberta farms, but a few are in forest areas, mountains and cities to give a detailed weather picture across the province.
Wright said staff are working to add more stations in the vacant areas of the map. This year, they are targeting the Peace River region.
Stations cost $20,000 each and must be located in an open area, which is representative of the surrounding agriculture area, to ensure accurate readings.
“We pounded the pavement of who wanted a weather station or who was interested in the target area,” said Wright. “You can’t just throw a meteorological station anywhere.”
The website has become a handy tool for developing irrigation schedules, drought management plans and spray schedules since it became more detailed. An insect prediction map will be added this year.
“It is a great way to see how weather may impact your farm and impact your growth.”
Engineers use the website to study extreme weather patterns before designing transmission towers, buildings or other large structures, Wright said.
Counties use it to manage fire risk in agricultural areas. Skiers and snowboarders check to see if snow has fallen near their recreational destinations.
“I even had mushroom pickers say they love the website. They can see what areas are wet and go there,” said Wright.
“I’ve (had) trappers say they look at the website to see if snow has fallen on the trap line.”
The website can be used as a party trick to predict when a weather cell will arrive or pass over a specific location.
“It’s even better in the summer,” Wright said. “You can track thunderstorms and see them all moving and where it’s going to end. You can see the backside of the storm.”