In trucks rolling down grid roads by Biggar, Sask., or bouncing across hayfields near Amaranth, Man., the cab commentary can sound similar this time of the year.
The driver will often turn to the passenger and say, “hmm, it looks a lot greener this year compared to last.”
Well, thanks to Agriculture Canada and Statistics Canada, it’s now possible to find out exactly how much greener it is.
The Crop Condition Assessment Program (CCAP) is a free web tool that monitors vegetation growth in the primary agricultural regions of Canada and the northern half of the U.S. Users, who are agriculture analysts, government officials and producers, can get a sense of cropland and pasture conditions near Bismarck, North Dakota, or in their own backyard.
Read Also
Canola used in only quarter of Canadian biofuel
Less than one-quarter of the biodiesel and renewable diesel used in Canada in 2024 was made from canola oil feedstock
CCAP can be accessed from a link at Agriculture Canada’s drought monitor page at www.agr.gc.ca/pfra/drought.
It measures the vegetative index during the growing season in comparison to a data record that goes back 20 years.
“The NDVI stands for the Normalized Difference Vegetation Index,” said Andrew Davidson, a climate data specialist with Agriculture Canada. “It can be thought of as an index that correlates really well with the greenness on the ground. So you get high NDVI values where you have really lush, green landscape.”
Statistics Canada used to provide the service solely to subscribers, but the assessment tool has been free and open to the public for the last few years, courtesy of an agreement with Agriculture Canada.
The site shows a map of Canada and the northern states, with a patchwork of green, yellow and orange pixels stretching from Edmonton to Chicago.
Davidson said users can zoom in on a specific area of interest, such as the region between Regina and Moose Jaw.
When the map is magnified, the land on either side of the Trans-Canada Highway between the two cities appears as a nearly continuous block of rich green pixels.
“The really dark green values are telling you that these are regions where it (the NDVI) is greater than 13.5 percent the normal,” Davidson said.
In addition, the website has a graph function that depicts how the vegetative index, in the Regina-Moose Jaw region, was behind normal in early June. But in the first week of July, it caught up and jumped ahead of the typical greenness for early July in that part of Saskatchewan.
“(It’s) comparing this week, to the same week in the last 20 years,” Davidson said.
A satellite gathers the data, which Statistics Canada processes to filter out tree foliage and other vegetation factors. The remaining remote sensing data is then compiled to accurately measure the greenness of crops and pastures.
It is possible, Davidson said, to narrow information down to the level of townships.
“When we start to look at smaller units … (like townships) it becomes more and more useful to producers,” he said, noting that the website does not provide data for a single pixel, one square kilometre, because that could potentially violate privacy laws.
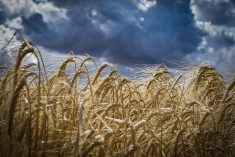
Statistics Canada also added a new feature to the site last year, an estimate of spring wheat yield based on the vegetative index data.
In 2007, the satellite data produced a spring wheat forecast that was 10 percent higher than the traditional yield estimates that are based on producer interviews. The producer estimates were more accurate.
Yield forecasts for this crop year will be released in the next week or two, Bedard said, noting that estimates for other major crops may be added to the site next year.