The adage “the trend is your friend” echoes in the minds of seasoned grain and futures traders. Keeping tabs on market trends is important, but accurately gauging when trends begin to turn is a bankable skill.
What follows is an update on long-term crop market downtrends and a box of tools to help identify when change is in the air.
Resilient crop markets
Read Also

U.S. agricultural trade slipping: report
The U.S.’s global trade advantage on agriculture products is eroding and the deficit is expected to grow, says a University of Illinois study
Most markets posted major bull-market peaks in the spring of 2022, when Russia invaded Ukraine. Since then, it’s been down, down, down … with only a few jabs to the upside.
Markets were unable to make new highs during rallies, while the dips consistently notched new lows.
Lately, though, crop markets have been more resilient.
For corn, soybeans and canola, the dips of the past summer and fall did not fall below the lows of 2024. It was a positive signal that these markets managed to move higher in October, even with the full weight of the North American harvests upon them.
Waning downside momentum
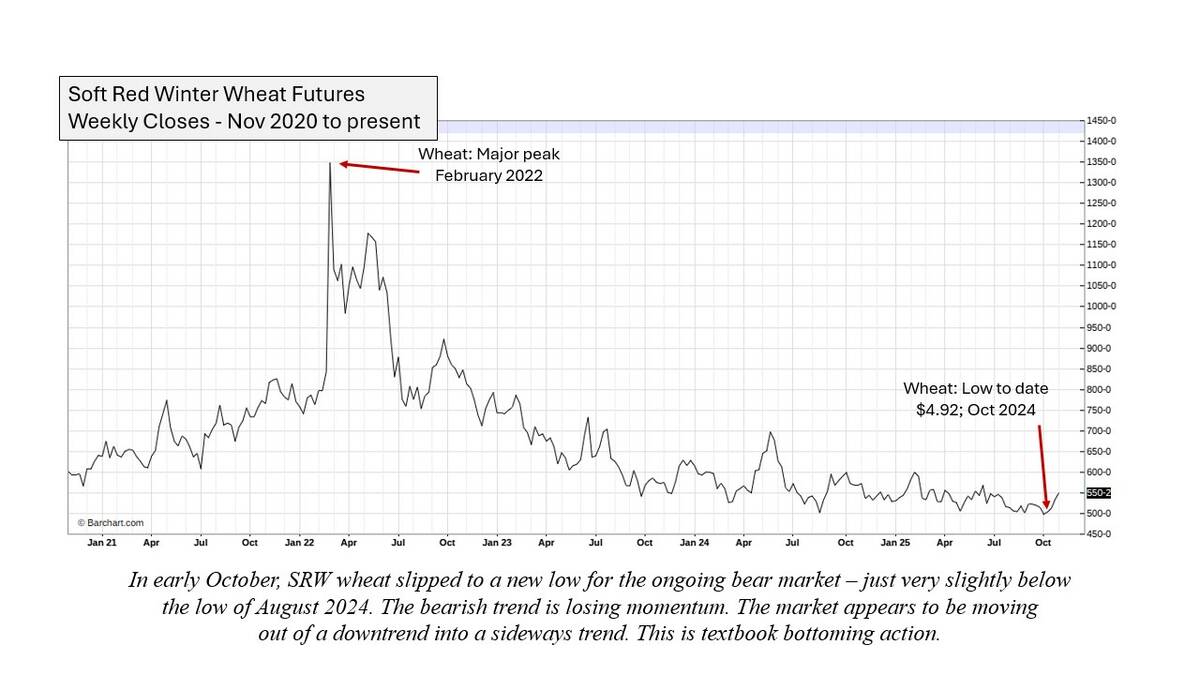
Only the wheat markets slipped to new lows this fall. However, the recent declines are minor compared with those of the previous 36 months. Loss of bearish momentum such as this is a sign of a bottoming market.
A column several weeks ago examined the big picture for wheat, suggesting futures were starting to work on forging major lows. Recent chart action supports that theory.
Vigorous response to bullish news
In August and September, soybeans did not fall heavily, despite export hold-ups. The Trump administration’s antics with China slashed soybean sales. Nonetheless, beans held their ground above US$9.50. This was a sign of underlying strength.
Just as importantly, in mid to late October (amid hints of a loosening of trade threats), the soybean market vigorously rallied. When a market doesn’t fall on bearish news and then responds strongly to bullish news, you have a display of solidity.
From December through January, South American weather will have a big impact on prices. Early indications point to a large crop. Threats to the crop could bring rallies.
A rare string of gains
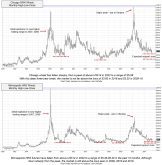
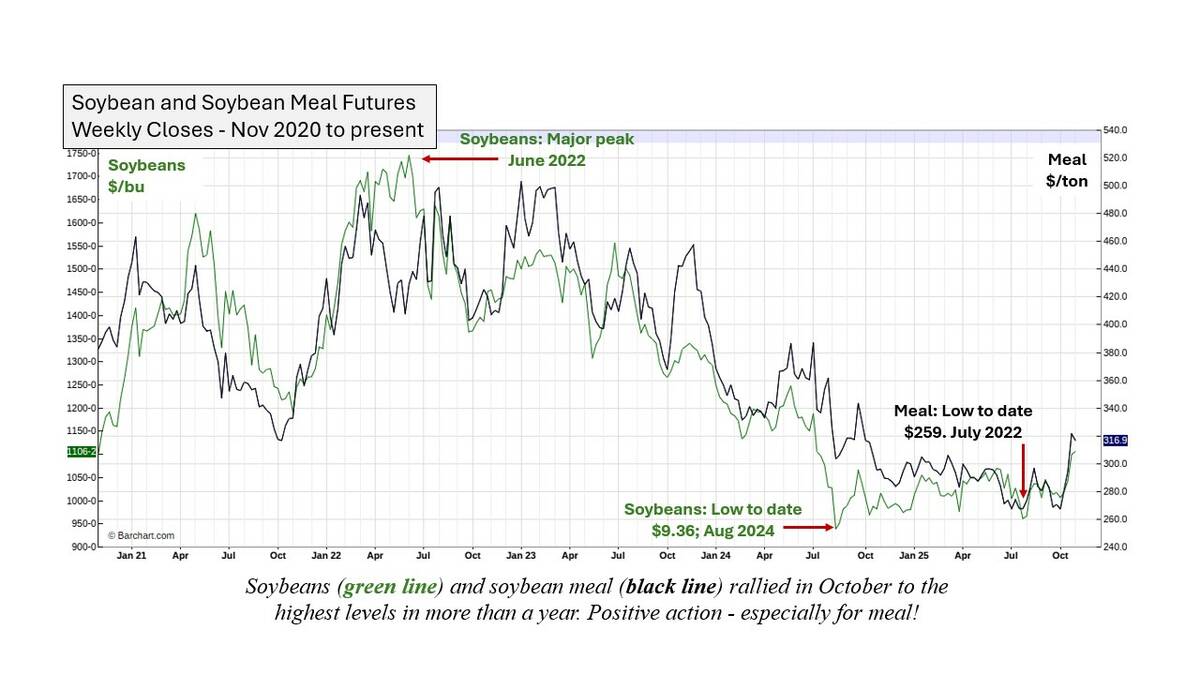
From Oct. 14 to 31, soybean meal futures rallied for 14 straight days. When a low-priced commodity in a low-level trading range suddenly pops up with such consecutive daily advances, it’s a sign that a new fundamental factor is coming into play.
That factor may have been a U.S. trade deal with China. Additionally, meal had been underpriced relative to its sister product, soybean oil, and was bound to recover at some point. Finally, it happened. Don’t be surprised if the meal-oil spread continues to favour meal.
The graph of soybean futures overlaid with meal shows a high correlation between meal and soybean futures. It also illustrates that they sometimes part company. Meal performed better than beans in October and could keep doing so.
Meal will probably retrace some of its recent gains in November and/or December. If so, this would be a buying opportunity for meal users.
Resistance to political headwinds
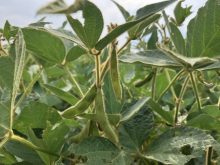
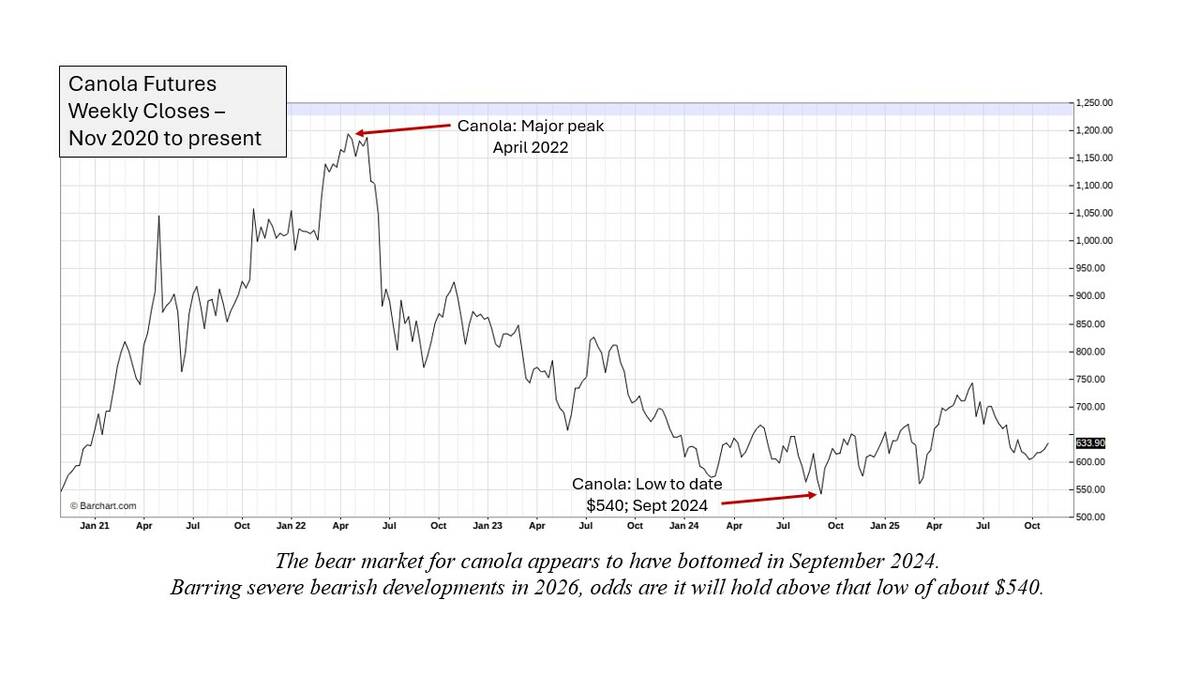
Political sparring saw China spurning Canadian canola and canola products the past several weeks. Despite this, canola futures stayed above the September 2024 chart low. That’s a remarkable performance, considering not only the export shortfall but also the size of the crop. It’s pegged at about 20 million tonnes, up from 19.2 million in 2024.
Here again we see a market standing up well against seemingly negative news.
Ability to withstand seasonal pressure
Corn futures often endure harvest pressure this time of year.
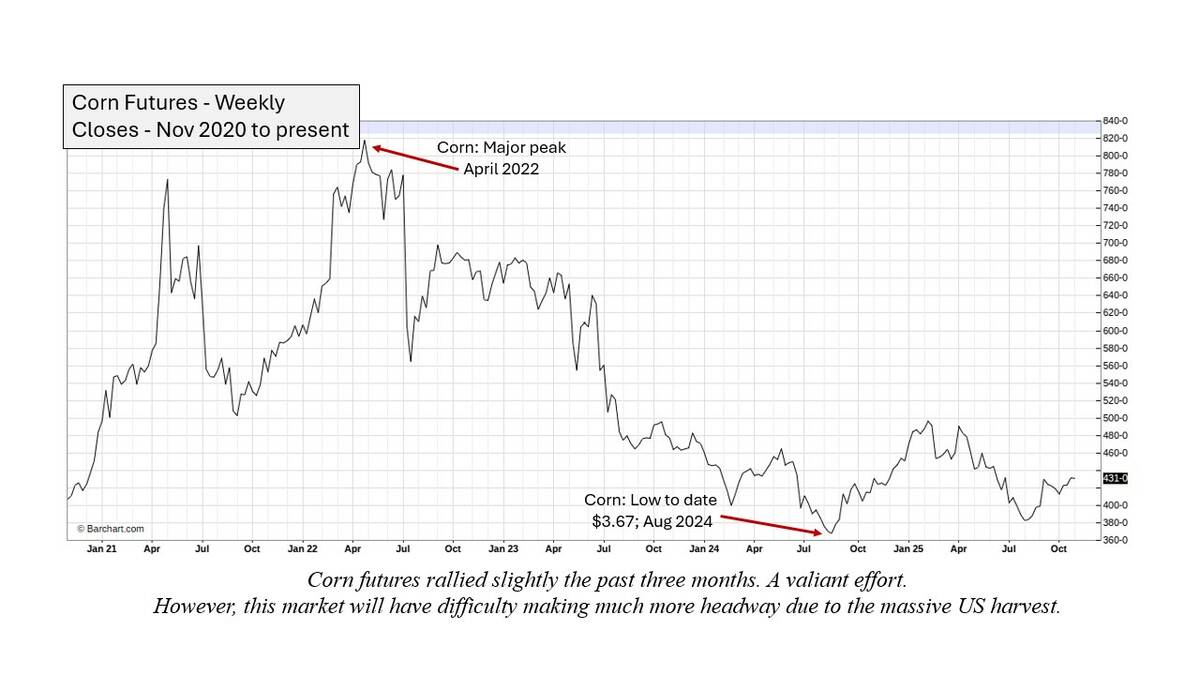
Corn growers should be careful about relying on significant upside this fall. It might even be a good idea to brace for seasonal weakness ahead. The U.S. crop is rolling off and it’s huge — about 16.8 billion bushels. That’s up 13 per cent from 14.9 per cent in 2024.
Notably, the market is currently trading above where it was a year ago. This is an impressive feat, considering the much bigger harvest. It will be interesting to see whether corn can keep holding up against the brunt of harvest. It probably won’t, but if it can, this could signal that demand is building in the background — and that the major bear market is over.
Looking forward to a bright new year
The crop markets did pretty well in October. As they wind their way up and down this winter, don’t bet on them suddenly turning super bullish. As of yet, there are no clear uptrends. We live in a world of uncertainty. Bearish shocks caused by large Southern Hemisphere crops, geopolitical issues, economic or currency surprises could still weigh on prices.
However, at least some tools in the analysis toolbox point to a gradual shift out of the major bearish trends that began in 2022.
Let’s dust off some long-shelved optimism as we move toward 2026. The markets should be less bearish than the past three years, even if there are some rough spots along the way.