Winnipeg (CNS Canada) – ICE Futures Canada canola contracts were mostly lower on Friday, as strength in the Canadian dollar and confirmation of large planted area weighed on values.
In a report out this morning, Statistics Canada pegged canola seedings at 22.7 million acres, which was well above an earlier estimate of 21.4 million but in line with trade guesses and still about 250,000 acres below the record area seeded in 2017.
Improving moisture conditions across Western Canada also put some pressure on values, as traders square positions ahead of the long weekend. Canadian markets will be closed Monday for Canada Day, while markets in the United States will remain open.
Read Also
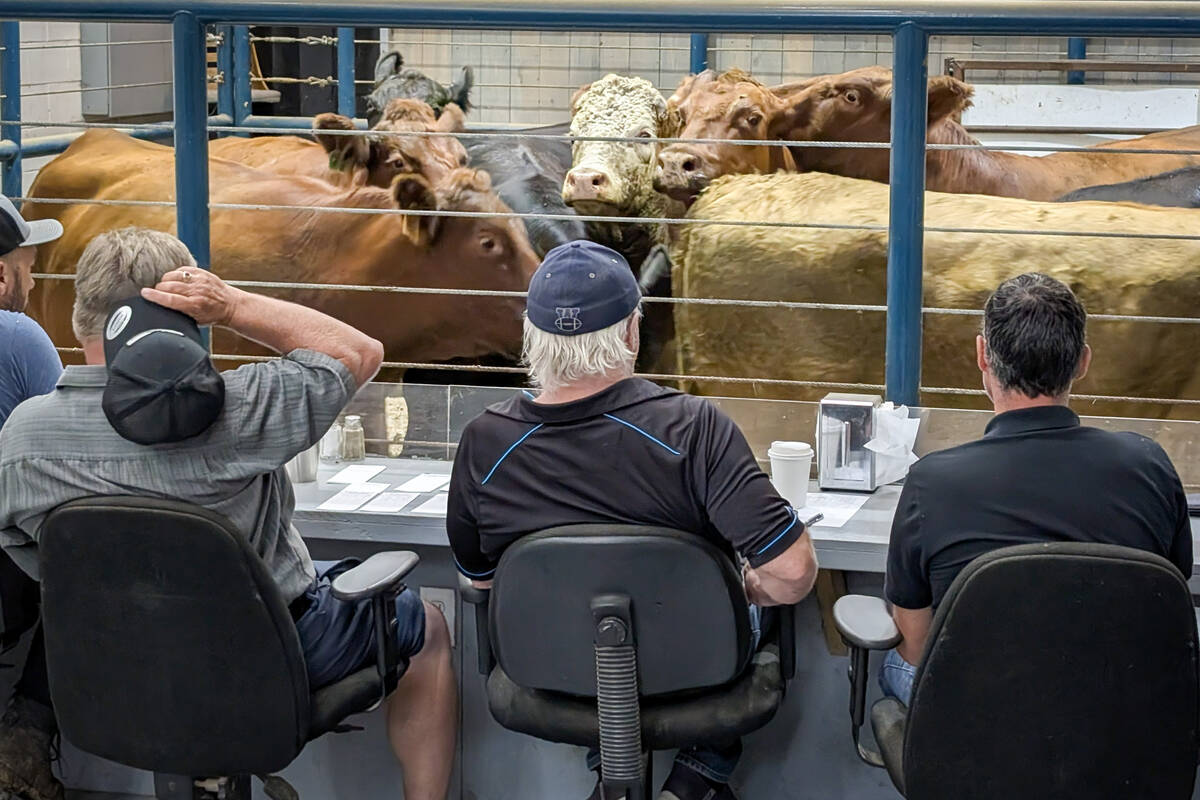
U.S. livestock: Cattle rally, hogs slide
Chicago cattle futures regained a ground on Monday to maintain a fairly level trajectory after last week’s fall.
The Canadian dollar was up by about half a cent relative to its U.S. counterpart, which weighed on prices.
About 10,793 canola contracts traded, which compares with Thursday when 26,828 contracts changed hands. Spreading accounted for 8,048 of the contracts traded.
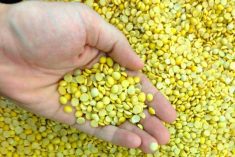
SOYBEAN futures were weaker on Friday as the market reacted to the United States Department of Agriculture’s latest acreage and stocks estimates.
The USDA raised its forecast for U.S. soybean plantings to 89.5 million acres, which was up by about half a million from an earlier estimate. However, average market expectations had been for an even larger acreage base, and soybeans found some support from the number.
Quarterly U.S. soybeans stocks as of June 1, at 1.2 billion bushels, marked a new record for that time of year, but were in line with expectations.
Canadian soybean area this year was pegged at 6.3 million acres by Statistics Canada, which would be a drop of about a million acres from 2017.
CORN futures were up on the day, finding some support from a rally in wheat.
OUTSIDE MARKETS
Light crude oil nearby futures in New York was up 70 cents at US$74.15 per barrel.
In the afternoon, the Canadian dollar was trading around US76.13 cents, up from 75.44 cents the previous trading day. The U.S. dollar was C$1.3135.
Winnipeg ICE Futures Canada dollars per tonne.
Canola Jul 18 521.00s +10.60 +2.08%
Canola Nov 18 509.40s -1.00 -0.20%
Canola Jan 19 514.30s -1.90 -0.37%
Canola Mar 19 517.10s -1.90 -0.37%
Canola May 19 518.50s -1.90 -0.37%
American crop prices in cents US/bushel, soybean meal in $US/short ton, soy oil in cents US/pound. Prices are displayed with fractions (2/8, 4/8, and 6/8) instead of decimals. -2 equals .25, -4 equals .50, -6 equals .75. The “s” means it is the settlement.
Chicago
Soybeans Jul 18 858-4s -2-6 -0.32%
Soybeans Aug 18 863-4s -3-2 -0.37%
Soybeans Sep 18 869-2s -3-2 -0.37%
Soybeans Nov 18 880-0s -3-4 -0.40%
Soybeans Jan 19 889-0s -3-4 -0.39%
Soybean Meal Jul 18 332.8s +1.4 +0.42%
Soybean Meal Aug 18 331.0s +0.3 +0.09%
Soybean Meal Sep 18 330.9s -0.2 -0.06%
Soybean Oil Jul 18 29.12s +0.11 +0.38%
Soybean Oil Aug 18 29.23s +0.10 +0.34%
Soybean Oil Sep 18 29.34s +0.09 +0.31%
Corn Jul 18 350-2s +5-2 +1.52%
Corn Sep 18 359-4s +5-2 +1.48%
Corn Dec 18 371-2s +5-2 +1.43%
Corn Mar 19 381-2s +5-4 +1.46%
Corn May 19 388-0s +5-6 +1.50%
Oats Jul 18 250-4s +7-4 +3.09%
Oats Sep 18 240-0s +2-4 +1.05%
Oats Dec 18 245-0s +7-4 +3.16%
Oats Mar 19 249-2s +7-6 +3.21%
Oats May 19 251-2s +7-4 +3.08%
Wheat Jul 18 497-4s +18-0 +3.75%
Wheat Sep 18 501-2s +17-6 +3.67%
Wheat Dec 18 516-6s +17-2 +3.45%
Wheat Mar 19 532-2s +17-0 +3.30%
Wheat May 19 543-6s +16-6 +3.18%
Minneapolis
Spring Wheat Jul 18 521-4s unch unch
Spring Wheat Sep 18 536-6s -0-6 -0.14%
Spring Wheat Dec 18 554-4s -0-6 -0.14%
Spring Wheat Mar 19 570-4s -0-4 -0.09%
Spring Wheat May 19 580-4s -0-6 -0.13%
Kansas City
Hard Red Wheat Jul 18 470-6s +17-4 +3.86%
Hard Red Wheat Sep 18 488-4s +16-4 +3.50%
Hard Red Wheat Dec 18 511-4s +16-0 +3.23%
Hard Red Wheat Mar 19 530-2s +15-6 +3.06%
Hard Red Wheat May 19 542-6s +15-6 +2.99%
Chicago livestock futures in US¢/pound, Pit trade
Live Cattle Jun 18 107.000s -1.200 -1.11%
Live Cattle Aug 18 106.725s +3.000 +2.89%
Live Cattle Oct 18 110.025s +3.000 +2.80%
Feeder Cattle Aug 18 151.325s +4.500 +3.06%
Feeder Cattle Sep 18 150.950s +3.575 +2.43%
Feeder Cattle Oct 18 150.075s +2.800 +1.90%
Lean Hogs Jul 18 82.875s +1.750 +2.16%
Lean Hogs Aug 18 76.450s +0.725 +0.96%
Lean Hogs Oct 18 59.775s -1.650 -2.69%