WINNIPEG, Aug. 29 – Declining prices for crops across the board during the past year are reflected in the latest Farm Product Price Index released today by Statistics Canada.
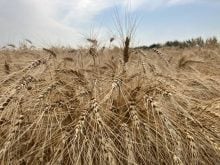
The crops index fell 2.8 percent in June to 122.8, compared to June of 2016, a loss StatsCan attributed to grains and special crops. The grains index fell 4.7 percent compared to the same month a year ago to 104.8 in keeping with a general downward trend that started in July 2016 when global grain stockpiles started to grow.
However, the June decline was the smallest drop since November 2016, with weather concerns beginning to cast doubt on the North American crop for this year, StatsCan said.
Read Also

Canada offers tariff relief to some steel, aluminum products from U.S., China
Canada offered tariff relief on some steel and aluminum products imported from the U.S. and China, a government document showed, in efforts to help domestic businesses battered by a trade war on two fronts.
While the index was down compared to a year ago, it was up 2.04 per cent from May.
The special crops index was at 148.2 for June compared to 210.7 in June of 2016, a 30 per cent decline, as world lentil and dry pea prices fell.
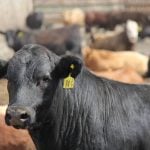
Meanwhile, increases in the livestock industry helped offset overall farm price declines. The cattle and calf index climbed 3.9 per cent in June compared to the same month a year ago.
Overall, the livestock and animal products index was up 1.8 per cent. This follows gains of 1.0 percent made for May, and May and June together now account for the first gains the livestock and animal parts index has made since StatsCan started reporting year-over-year data in October 2015.
The increase was due mainly to higher cattle and hog prices, StatsCan said, but eggs and dairy also contributed.
The hogs index was up 5.4 percent in June 2017 compared to June 2016 on the heels of two months of declines. Strong export demand offset higher hog supplies.
The FPPI measures price changes received by farmers for the sale of agricultural products and uses a five-year rolling average as its base.


