Commodity prices were hit hard today as soybeans retreated to near one week-old lows.
Canola felt the soybean decline as well as pressure from Chinese trade issues nationally. May canola fell $5, reaching $451.70, July canola was down $5.60 to$459.60, November canola felt the pain following $6.20 to $471.60. March canola for 2020 did a little better, it was off $3.90 following to $485.20.
On Chicago markets soybeans were down 5 3/4 US cents reaching nine dollars and 3/4 for May, while July was off the same, falling to $9.14 and a quarter.
Wheat and corn also felt negative pressure on Chicago markets.
Read Also
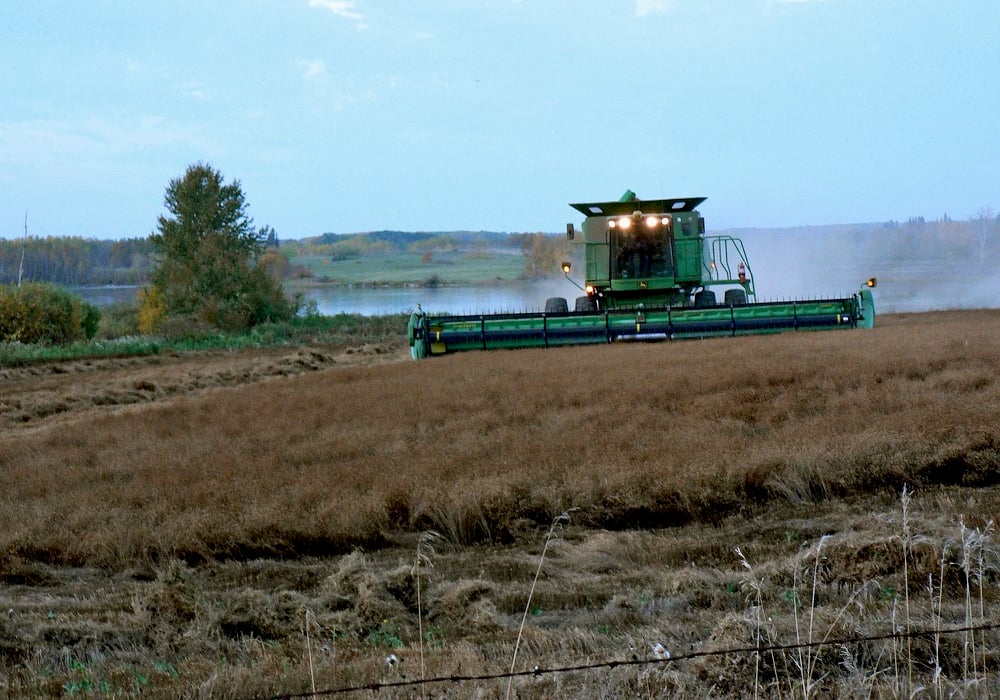
Most of Manitoba harvest wraps up for 2025
Manitoba Agriculture issued its final crop report of 2025, showing the overall provincewide harvest at 97 per cent complete as of Oct. 20. Nearly all major crops have finished combining, with 37 per cent of Manitoba’s sunflowers finished, plus 71 per cent of grain corn and small amounts of soybeans and potatoes left to do.
SOYBEAN futures at the Chicago Board of Trade were weaker on Tuesday.
As United States/China trade talks are set to get underway on Thursday, there are now indications that U.S. President Donald Trump will take a harder line against China. With the Mueller report no longer such a distraction for the president, he could delay a final agreement past the end of April, on the pretext of getting a better deal.
According to the March 1 grain stocks, U.S. soybeans are estimated at 2.68 billion bushels, down from 3.74 billion bushels in December.
In another acreage estimate, soybeans have been pegged at 86.2 million acres for 2019, down 3.4 per cent from last year.
CORN futures were weaker on Tuesday, as flooding in the U.S. has continued to make grain transportation difficult. The moderate to severe flooding could see U.S. farmers switch their planting intentions from corn to soybeans.
Stocks of U.S corn were estimated at 8.34 billion bushels, down from 11.95 billion bushels in December.
U.S. corn acres were estimated at 93.3 million acres for 2019, down 4.7 per cent from 2018.
WHEAT futures were also weaker on Tuesday. U.S. wheat stocks stood at 1.56 billion bushels for March 1, down from two billion bushels in December.
Wheat acres have estimated at 46.9 million acres for this year, as compared to 47.80 million acres in 2018.
Wheat crop conditions ranged from 74 per cent good to excellent in Oklahoma, 68 per cent good excellent in Colorado, 52 per cent in Kansas, and 39 per cent good to excellent in Texas.
OUTSIDE MARKETS
Light crude oil nearby futures in New York was up $1.12 at US$59.94 per barrel.
In the afternoon, the Canadian dollar was trading around US74.70 cents, down from 74.52 centsthe previous trading day. The U.S. dollar was C$1.3386.
Winnipeg ICE Futures Canada dollars per tonne.
Canola May 19 451.70s -5.00 -1.09%
Canola Jul 19 459.80s -5.40 -1.16%
Canola Nov 19 472.00s -5.80 -1.21%
Canola Jan 20 479.00s -5.60 -1.16%
Canola Mar 20 484.30s -4.80 -0.98%
American crop prices in cents US/bushel, soybean meal in $US/short ton, soy oil in cents US/pound. Prices are displayed with fractions (2/8, 4/8, and 6/8) instead of decimals. -2 equals .25, -4 equals .50, -6 equals .75. The “s” means it is the settlement.
Chicago
Soybean May 19 900-6s -5-6 -0.63%
Soybean Jul 19 914-2s -5-6 -0.63%
Soybean Aug 19 920-2s -5-6 -0.62%
Soybean Sep 19 925-2s -5-4 -0.59%
Soybean Nov 19 934-6s -5-0 -0.53%
Soybean Meal May 19 311.0s -4.1 -1.30%
Soybean Meal Jul 19 314.8s -3.6 -1.13%
Soybean Meal Aug 19 316.3s -3.4 -1.06%
Soybean Oil May 19 28.65s -0.17 -0.59%
Soybean Oil Jul 19 28.98s -0.16 -0.55%
Soybean Oil Aug 19 29.11s -0.16 -0.55%
Corn May 19 377-2s -2-4 -0.66%
Corn Jul 19 387-0s -2-2 -0.58%
Corn Sep 19 393-2s -2-0 -0.51%
Corn Dec 19 400-2s -1-4 -0.37%
Corn Mar 20 410-2s -1-4 -0.36%
Oats May 19 273-0s -2-2 -0.82%
Oats Jul 19 270-2s -2-0 -0.73%
Oats Sep 19 262-6s -2-2 -0.85%
Oats Dec 19 257-6s -2-2 -0.87%
Oats Mar 20 254-6s -2-0 -0.78%
Wheat May 19 469-2s -0-2 -0.05%
Wheat Jul 19 474-4s -0-4 -0.11%
Wheat Sep 19 482-4s -1-0 -0.21%
Wheat Dec 19 497-0s -1-4 -0.30%
Wheat Mar 20 510-0s -1-6 -0.34%
Minneapolis
Spring Wheat May 19 567-2s -6-0 -1.05%
Spring Wheat Jul 19 566-4s -3-2 -0.57%
Spring Wheat Sep 19 570-2s -3-6 -0.65%
Spring Wheat Dec 19 580-4s -4-0 -0.68%
Spring Wheat Mar 20 591-2s -3-6 -0.63%
Kansas City
Hard Red Wheat May 19 443-2s -6-0 -1.34%
Hard Red Wheat Jul 19 451-0s -6-4 -1.42%
Hard Red Wheat Sep 19 463-0s -6-4 -1.38%
Hard Red Wheat Dec 19 482-6s -6-4 -1.33%
Hard Red Wheat Mar 20 499-4s -6-2 -1.24%
Chicago livestock futures in US¢/pound, Pit trade
Live Cattle Apr 19 126.900s -0.675 -0.53%
Live Cattle Jun 19 120.725s -0.400 -0.33%
Live Cattle Aug 19 117.575s -0.400 -0.34%
Feeder Cattle Mar 19 142.750s +0.575 +0.40%
Feeder Cattle Apr 19 146.225s +0.025 +0.02%
Feeder Cattle May 19 149.800s -0.900 -0.60%
Lean Hogs Apr 19 79.725s +1.075 +1.37%
Lean Hogs May 19 86.650s -0.100 -0.12%
Lean Hogs Jun 19 95.325s -0.225 -0.24%